Earthquake research

How large earthquakes break

Plain-language summaries of my earthquake studies, each with figures from the paper. Most of them resolve how a rupture unfolded: where it started, which way it ran, how deep it went, and why it stopped. Many use the subevent inversion in SubMIT.

Large ruptures

How big earthquakes break across several faults or segments, and what that means for shaking and tsunamis.

Deep earthquakes

Earthquakes 100 to 700 km down inside sinking plates, where heat and pressure make ordinary brittle failure difficult.

Fault networks

Sequences, swarms, and small earthquakes that reveal the hidden geometry of faults.

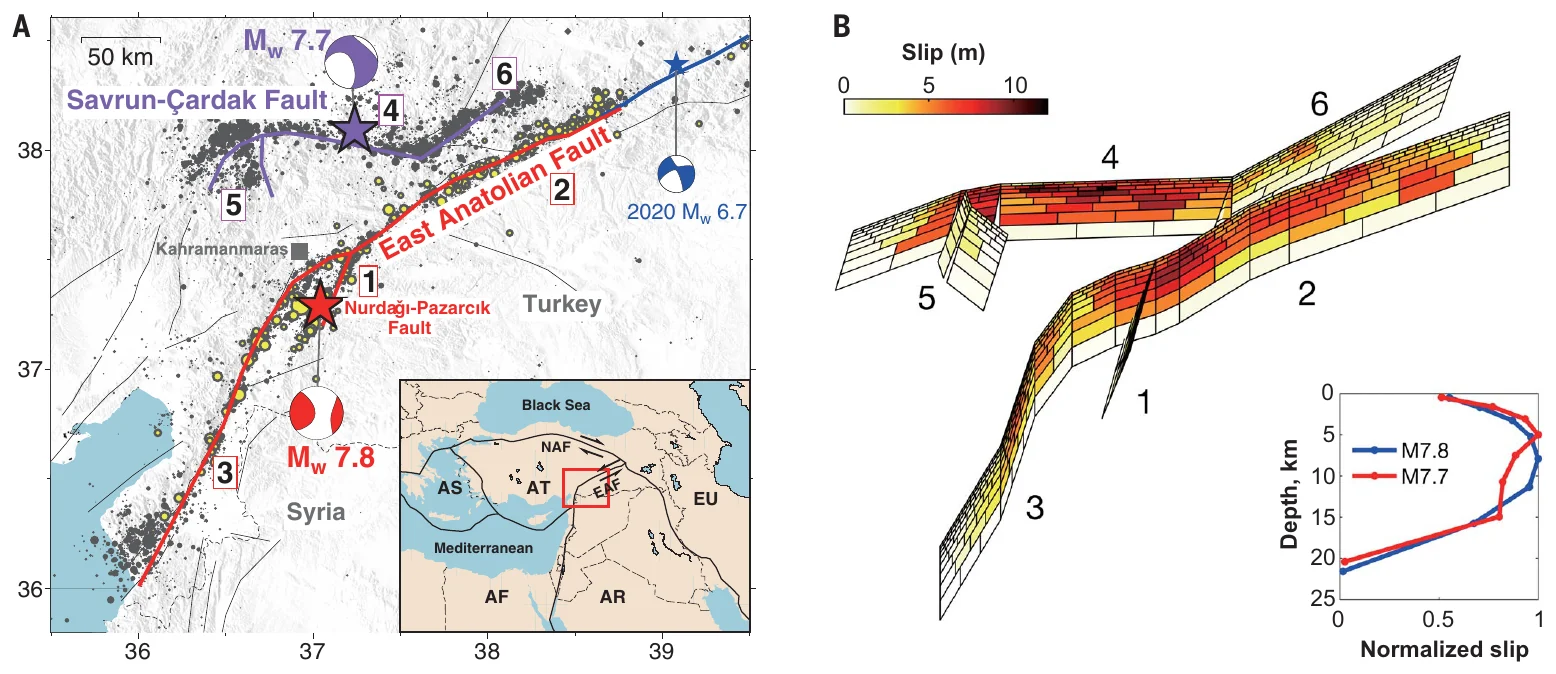
The two earthquakes broke at least six fault segments. Colors on the 3D fault model show how far each part of the fault slipped.
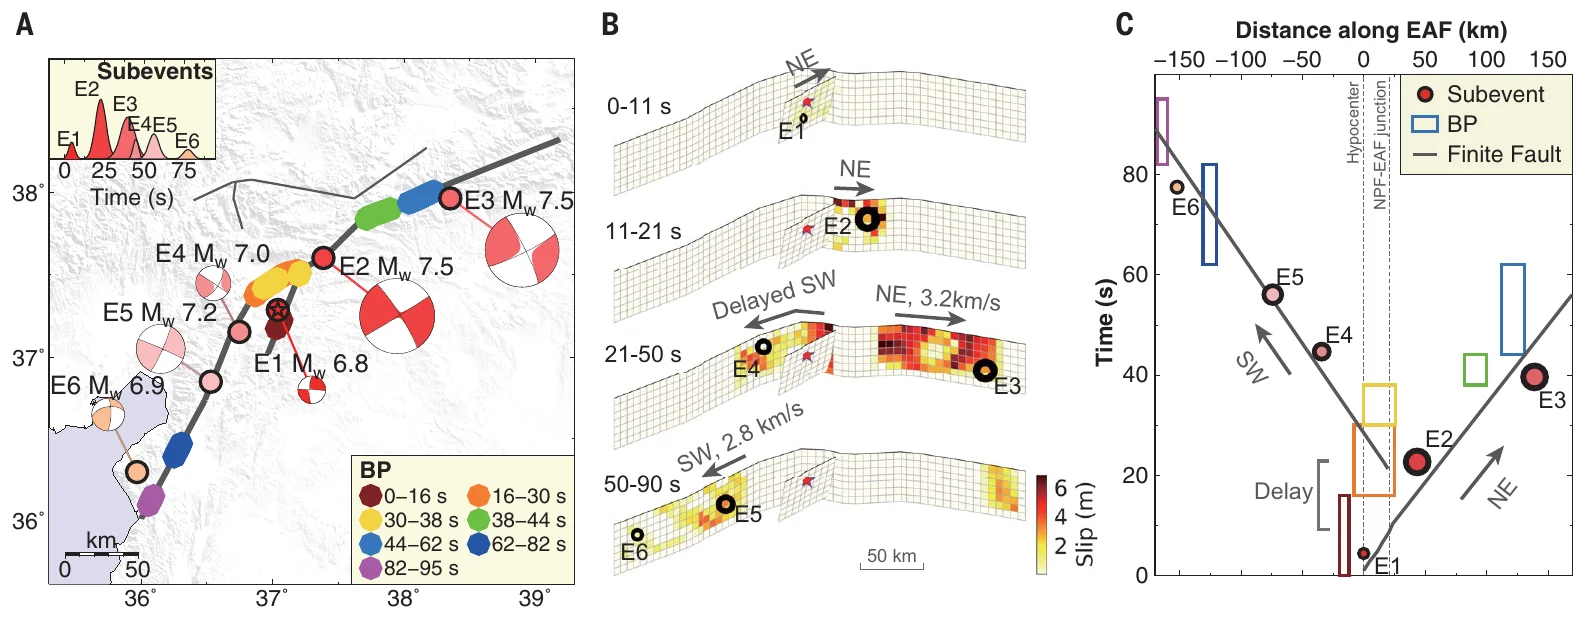
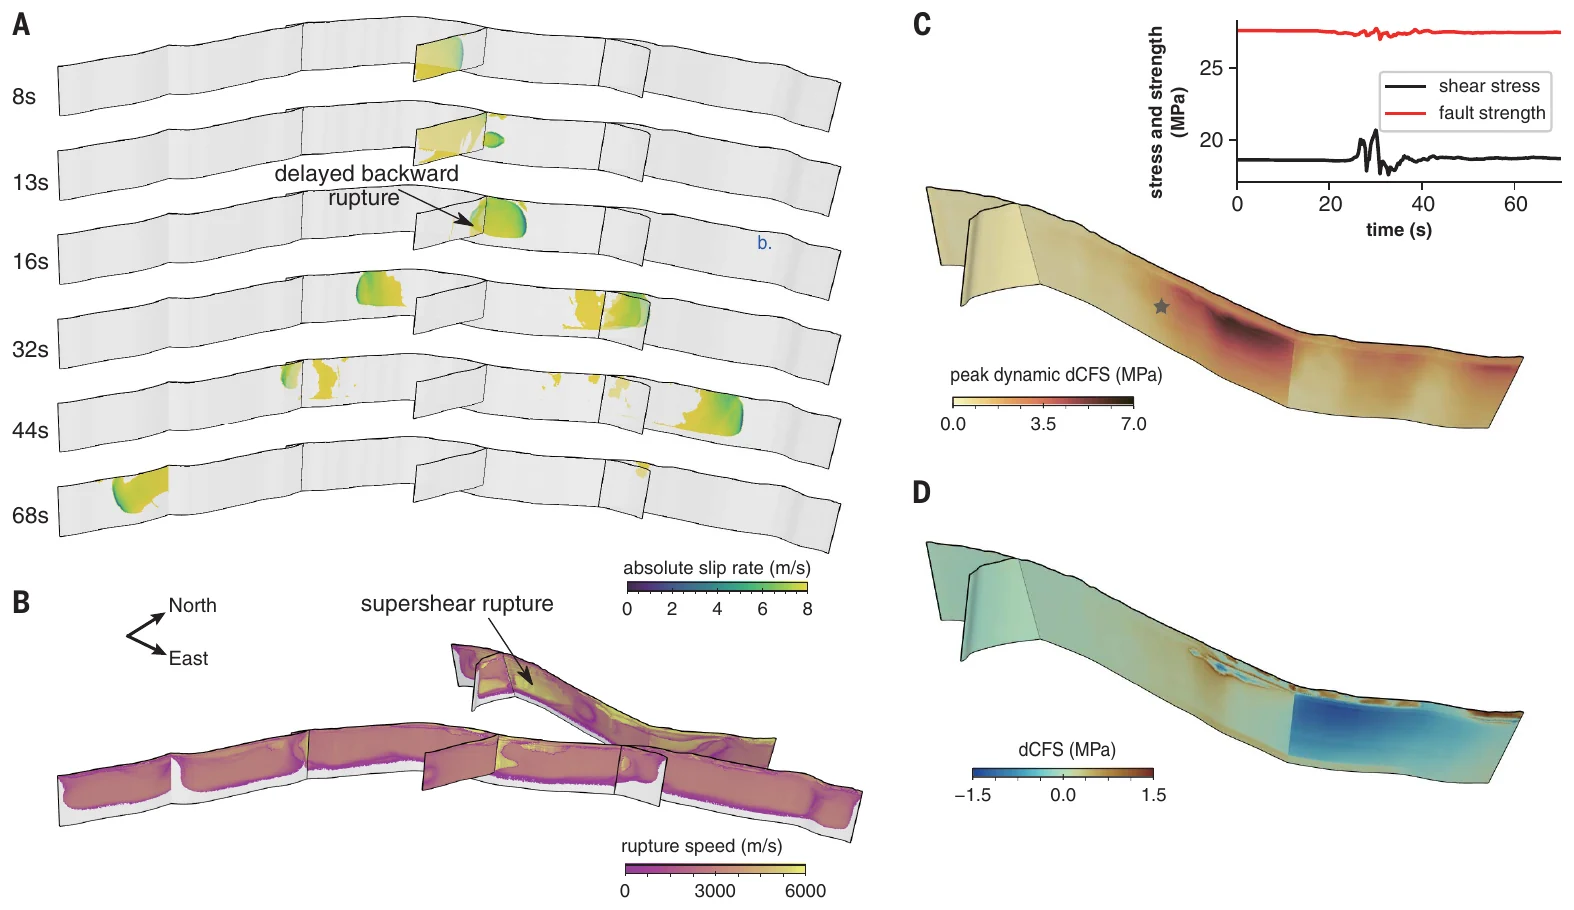
The magnitude 7.8 ran northeast first and began tearing southwest about 10 seconds later.Dynamic rupture simulations reproduce the delayed backward branch of the first earthquake and the supershear westward rupture of the second.
Feb 2023 · Mw 7.8 and 7.7Science cover

2023 Kahramanmaraş, Turkey, earthquake doublet

Jia, Z., Jin, Z., Marchandon, M., Ulrich, T., Gabriel, A.-A., Fan, W., Shearer, P. M., et al. (2023). The complex dynamics of the 2023 Kahramanmaraş, Turkey, Mw 7.8–7.7 earthquake doublet. Science.

On 6 February 2023, two earthquakes of magnitude 7.8 and 7.7 struck southeastern Turkey nine hours apart and caused tens of thousands of deaths in Turkey and Syria. We combined satellite radar and GPS maps of ground motion with seismic records from stations near the faults and around the world. We built models of how the faults slipped and ran physics-based rupture simulations on supercomputers.

The sequence broke at least six fault segments. The magnitude 7.8 began as a magnitude 6.8 rupture on a side fault, moved onto the East Anatolian Fault, and then ran about 300 km along it in both directions over about 90 seconds. The branch toward the southwest started about 10 seconds late. In the simulations, this backward branch became possible only after the rupture running northeast had unclamped and loaded the fault junction. The magnitude 7.7 broke a separate fault system to the north. Its westward rupture ran faster than shear waves, at about 4.5 km/s, and its eastward rupture at about 2.5 km/s.

Main findingRuptures jumped between faults and triggered each other across the fault network, growing far larger than the magnitude 7 earthquakes known from the region's history. Hazard models need to allow for such cascades.
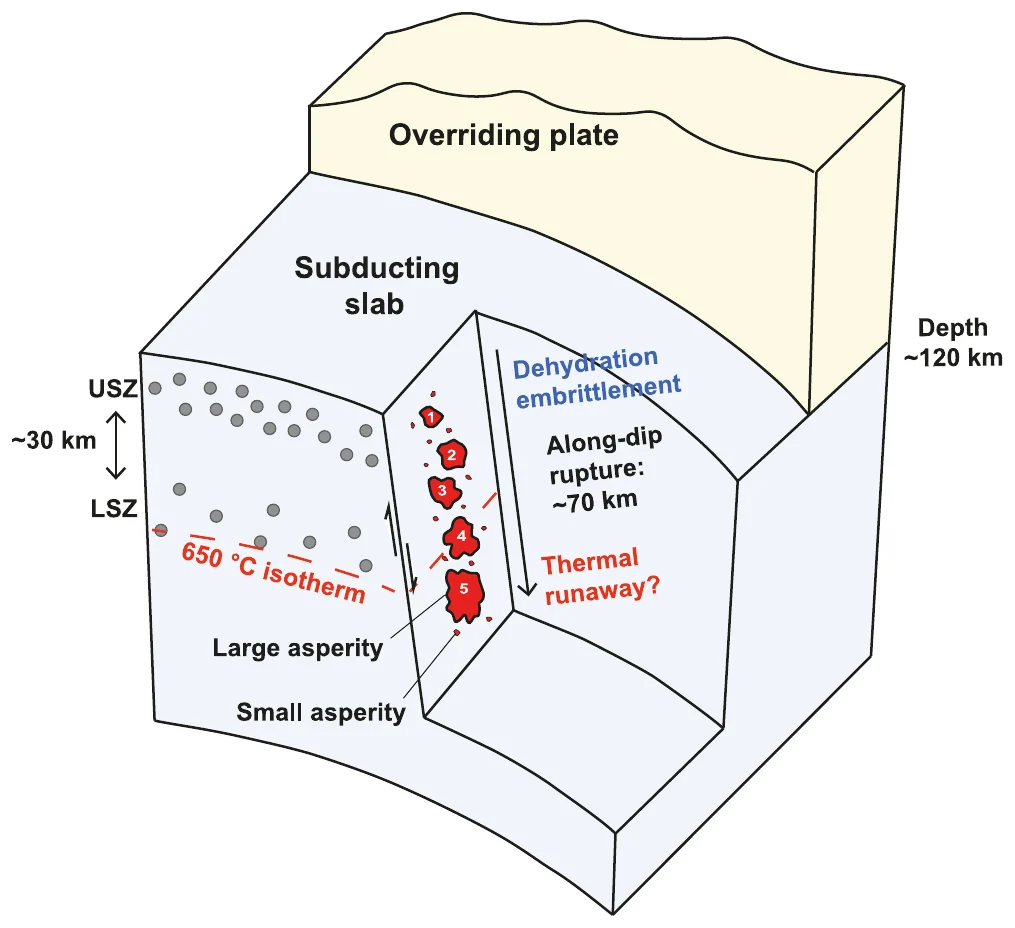
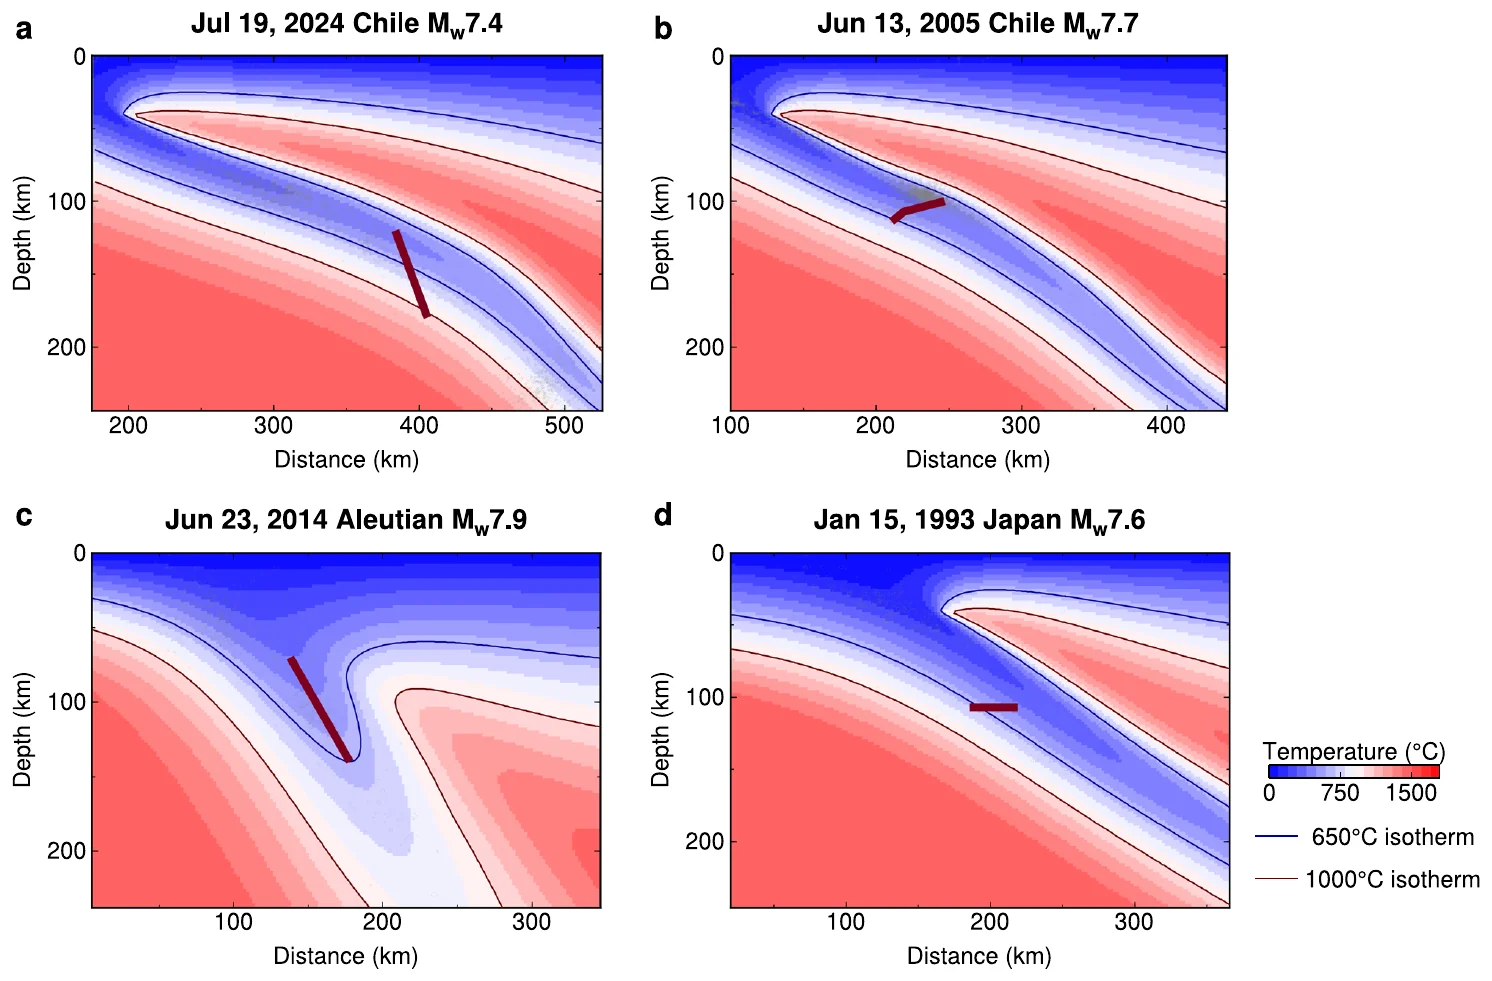
The rupture began in the cold core of the sinking plate and stepped down through five patches, crossing the 650 °C line into hotter rock.
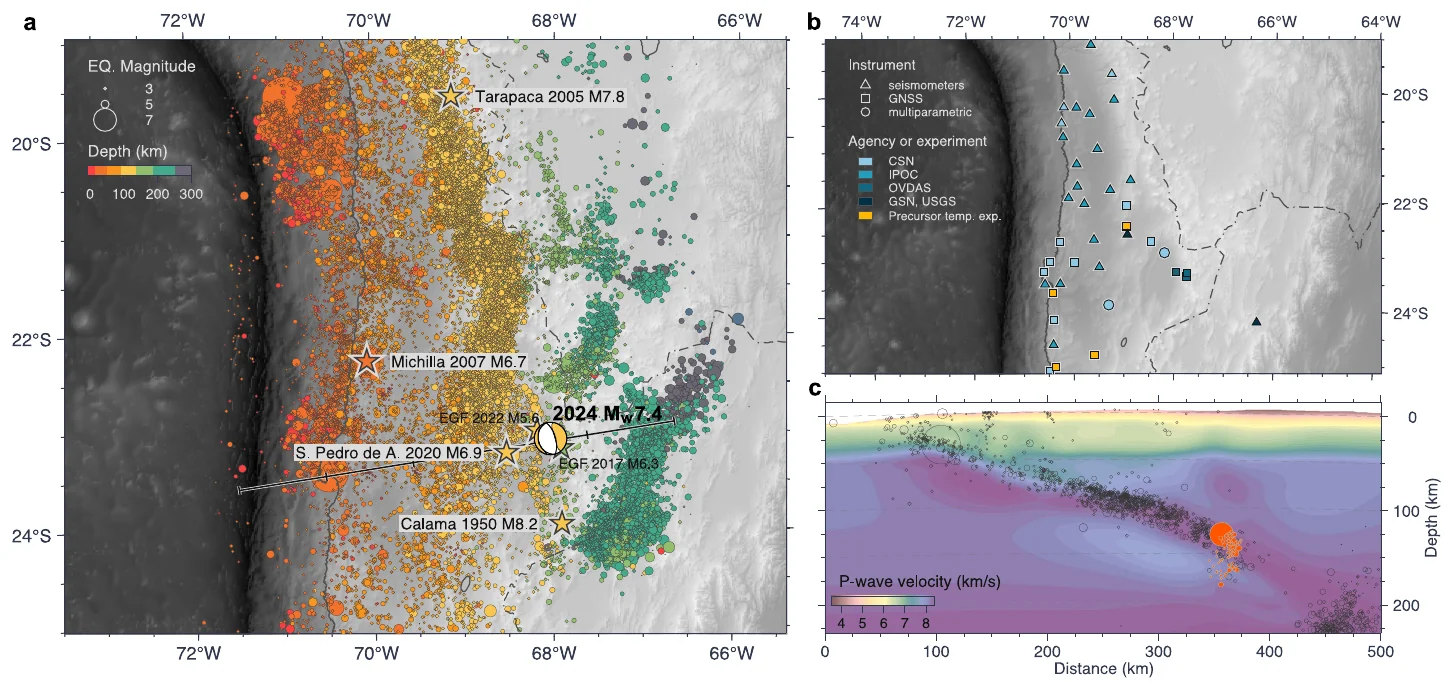
Earthquakes beneath northern Chile trace the Nazca plate diving under South America.Three other large intermediate-depth earthquakes stayed in cold slab rock. The 2024 Calama rupture (top left) cut into much hotter rock.
Jul 2024 · Mw 7.4 · 125–174 km deep

2024 Calama, Chile, intermediate-depth earthquake

Jia, Z., Mao, W., Flores, M. C., Barra, S., Ruiz, S., Potin, B., Becker, T. W., et al. (2025). Deep intra-slab rupture and mechanism transition of the 2024 Mw 7.4 Calama earthquake. Nature Communications.

On 19 July 2024, a magnitude 7.4 earthquake struck more than 120 km beneath Calama in northern Chile. It occurred inside the Nazca plate as the plate sinks under South America. At these pressures and temperatures rock tends to flow, and how such earthquakes happen is debated. They can be deadly: the 1939 Chillán earthquake of this type killed more people than any recorded megathrust earthquake in Chile.

We used 47 regional strong-motion stations, 54 global stations, GPS, and relocated aftershocks, and compared the rupture with temperature models of the slab. The earthquake broke as five subevents in about 20 seconds. It moved down a steep fault from 125 to 174 km depth, about 78 km in total, at about 4.2 km/s. It began in the cold core of the slab and continued into rock hotter than 650 °C. The usual explanation for these earthquakes is water released by minerals such as serpentine, and that process stops near 650 °C. The deeper, hotter part released about 80% of the seismic moment.

Main findingThe rupture likely switched from dehydration embrittlement to thermal runaway, where frictional heating weakens the fault. Normally quiet, hot parts of slabs can host large ruptures, so estimates of the largest possible intermediate-depth earthquakes may need revision.
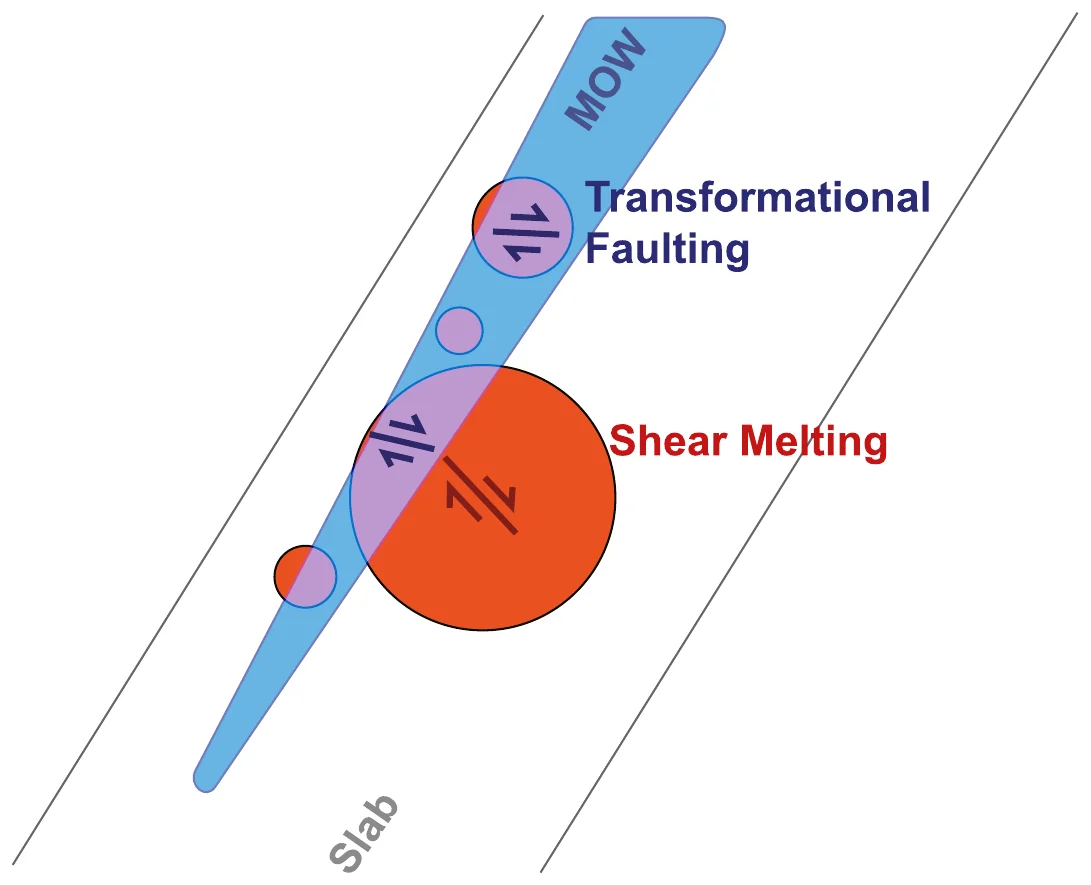
Small deep earthquakes stay inside the cold wedge of metastable olivine (MOW). The largest start there and break out into hotter rock, where shear melting keeps them going.
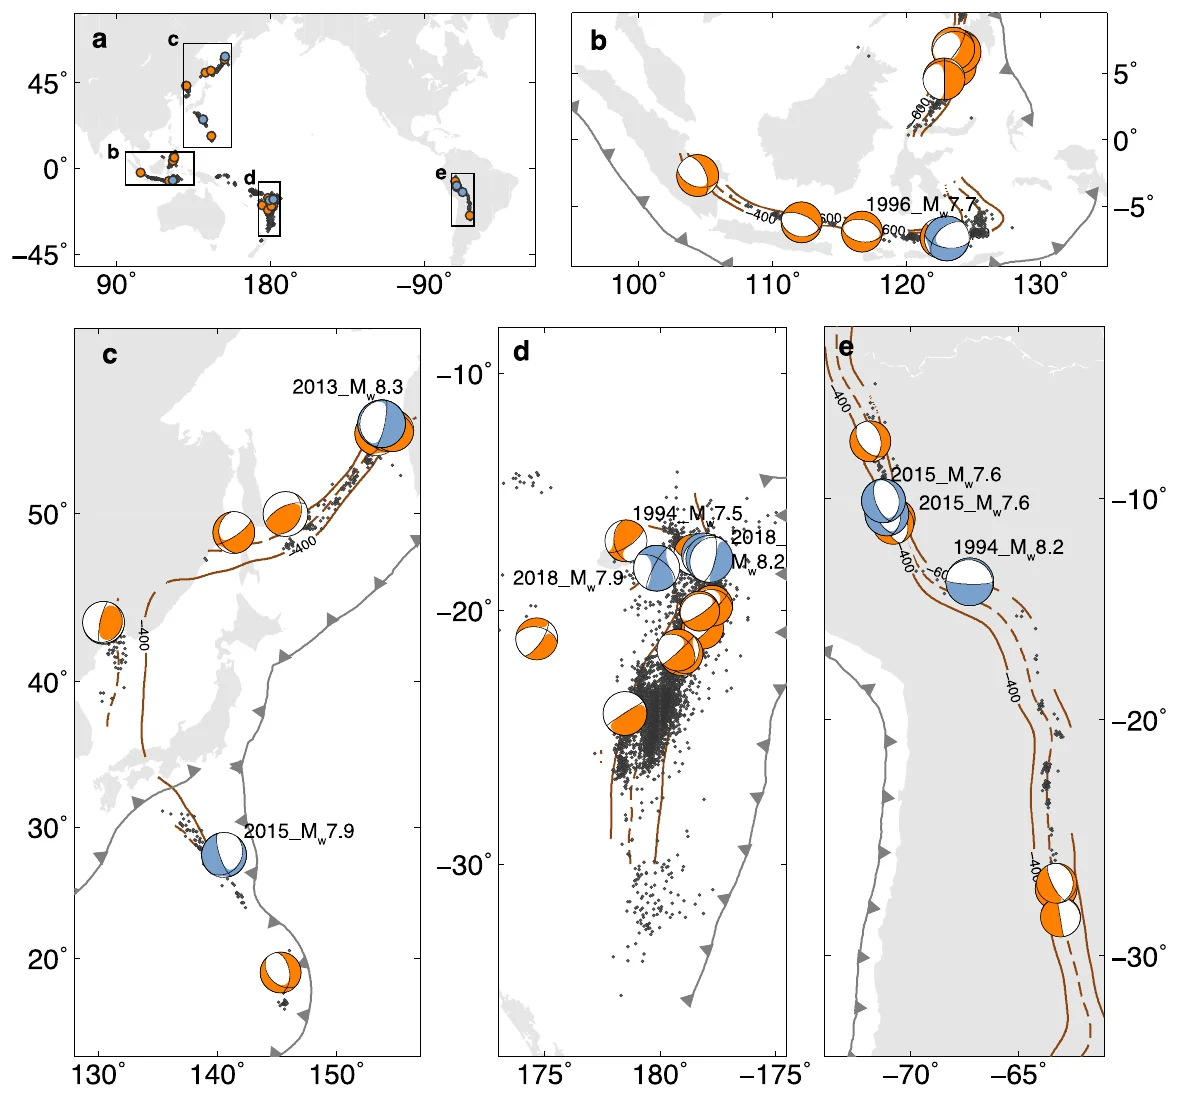
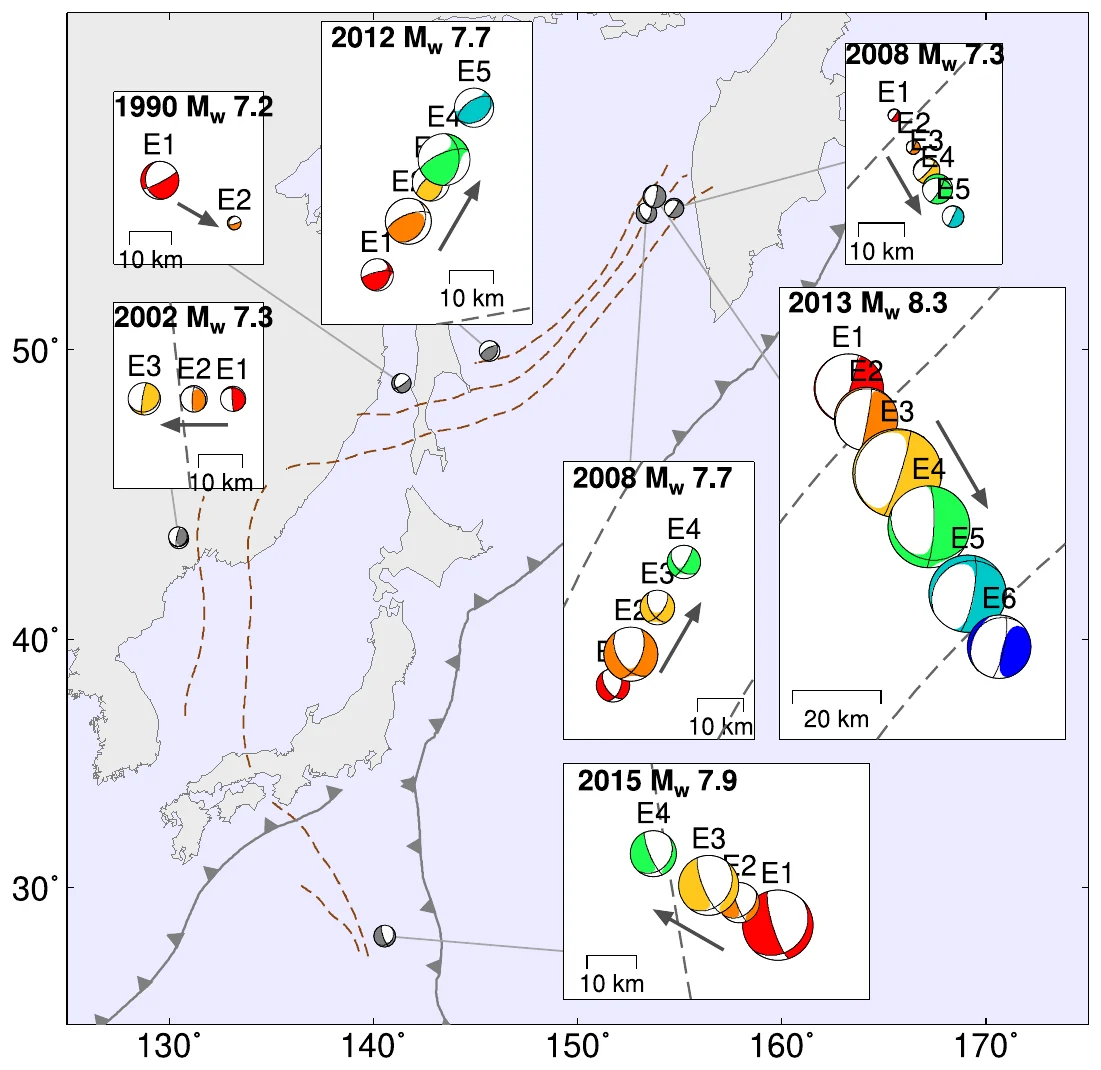
The 40 deep earthquakes larger than magnitude 7 from 1990 to 2023.Subevent models of seven deep earthquakes beneath the Kuril, Japan, and Bonin regions, colored from early to late.
1990–2023 · 40 deep earthquakes above M 7Eos Editors' Highlight

How large deep earthquakes grow

Jia, Z., Fan, W., Mao, W., Shearer, P. M., & May, D. A. (2025). Dual mechanism transition controls rupture development of large deep earthquakes. AGU Advances.

Earthquakes more than 500 km deep happen inside slabs of ocean plate sinking into the mantle. The pressure there prevents ordinary brittle failure. Deep earthquakes larger than magnitude 7 happen almost every year, and how they rupture has been debated for decades. We analyzed all 40 deep earthquakes larger than magnitude 7 from 1990 to 2023. For each one, we split the rupture into subevents with seismic waves recorded far away and measured how far, how fast, and in which direction it ran. We then compared the ruptures with temperature models of seven subduction zones.

The models predict a narrow, cold wedge of metastable olivine inside each slab. This mineral can transform suddenly under pressure and start a rupture. Most large deep earthquakes appear to begin inside the wedge. In 25 of the 31 events with well-known slab geometry, the rupture likely extended beyond the wedge into hotter rock. These earthquakes released more moment over shorter ruptures, and their stress drops rose from about 10 MPa below magnitude 7.5 to about 100 MPa on average above it.

Main findingTwo mechanisms act in sequence. Transformational faulting starts the rupture, and thermal runaway lets it grow beyond the cold wedge. Together they explain large deep earthquakes from the coldest slab (Tonga) to the warmest (South America).
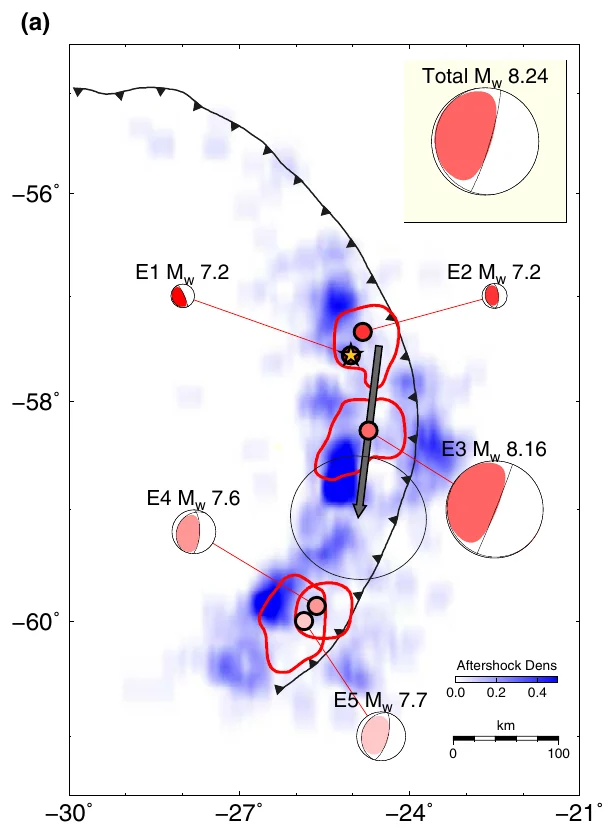
The five subevents along the trench. The gray arrow marks the slow subevent E3, which moved about 180 km south.
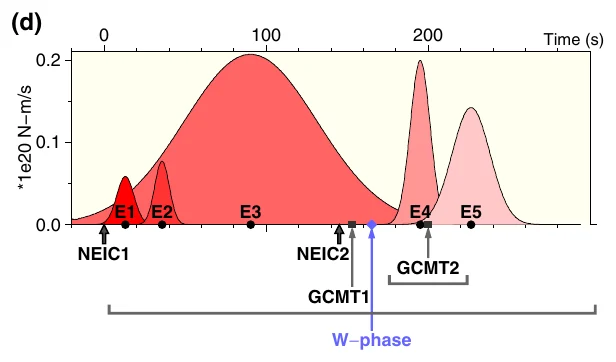
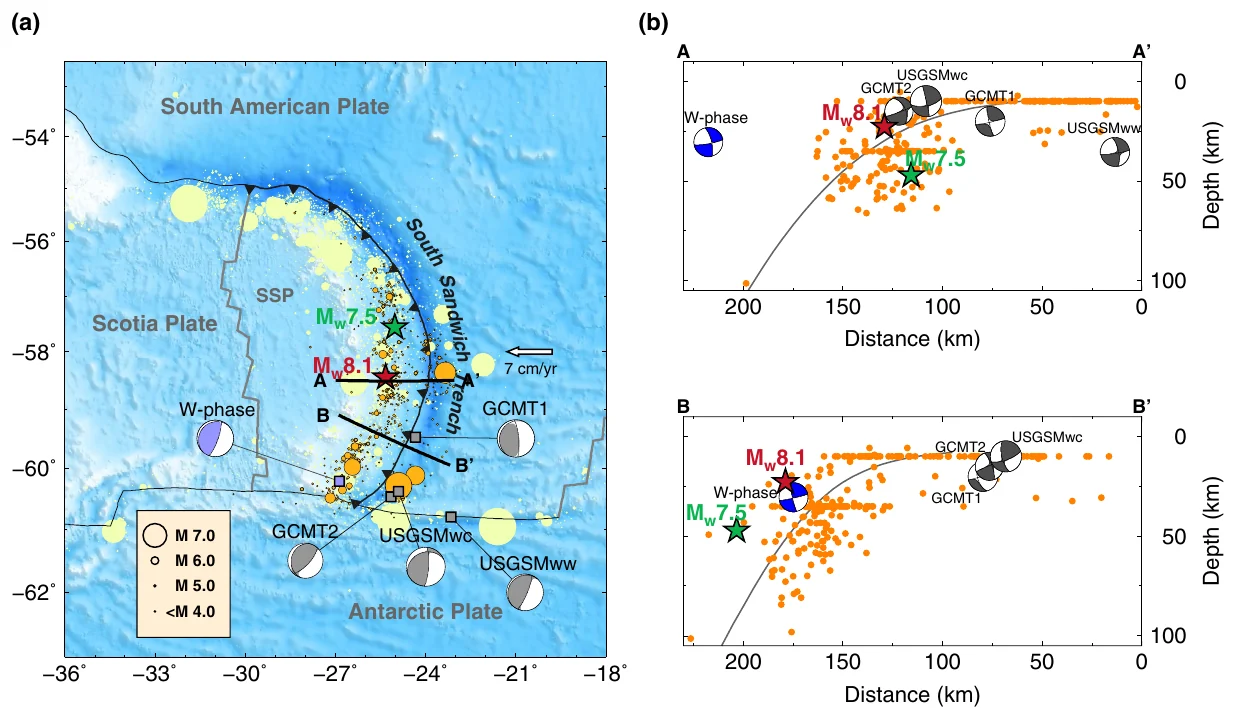
Moment release over about 260 seconds. The broad slow rupture E3 sits between short, sharp ordinary ruptures.The South Sandwich trench in the South Atlantic, with the foreshock, mainshock, aftershocks, and catalog solutions.
Aug 2021 · Mw 8.2

2021 South Sandwich Islands earthquake and tsunami

Jia, Z., Zhan, Z., & Kanamori, H. (2022). The 2021 South Sandwich Island Mw 8.2 earthquake: A slow event sandwiched between regular ruptures. Geophysical Research Letters.

On 12 August 2021, a large earthquake struck near the South Sandwich Islands in the South Atlantic. It was first reported as a magnitude 7.5 at 47 km depth. It then produced a tsunami that reached the Atlantic, Pacific, and Indian Oceans, with waves of about 20 cm on tide gauges more than 10,000 km away. A tsunami that large is expected only from a bigger and shallower earthquake.

We compared magnitudes measured from short-period and long-period seismic waves, and modeled seismograms at periods up to about 500 seconds as a sequence of subevents. The earthquake was a five-part sequence, about 300 km long, that lasted about 260 seconds. Ordinary thrust ruptures at the start and end surrounded a slow subevent of magnitude 8.16 at about 14 km depth. This slow subevent moved south at about 1 km/s for about three minutes. It released more than 70% of the total moment and produced very little short-period shaking.

Main findingA slow, tsunami-generating rupture was hidden between ordinary ruptures. It explains both the low early magnitudes and the large tsunami, and it shows why tsunami warning needs long-period seismic data.
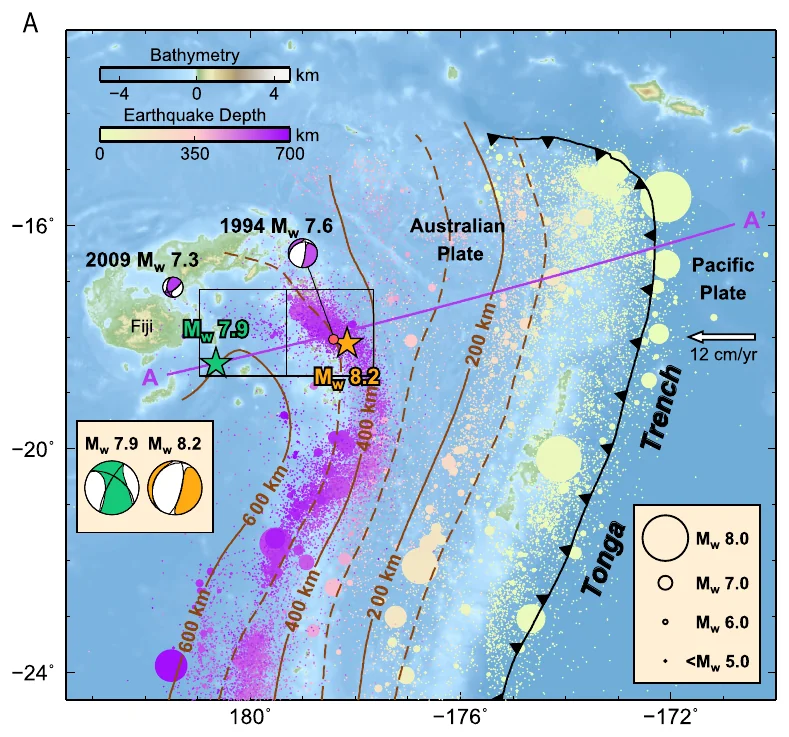
Where the Pacific plate dives beneath Fiji, a magnitude 8.2 (orange star) and a magnitude 7.9 (green star) struck three weeks apart.
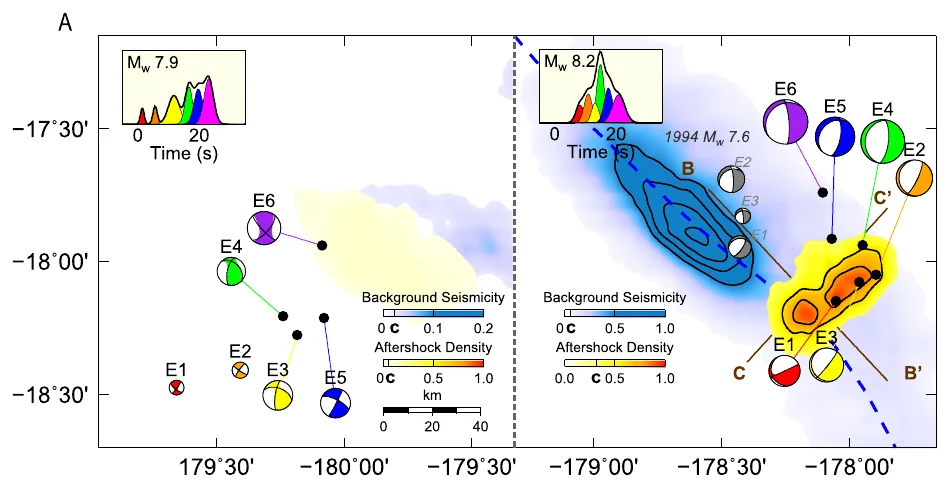
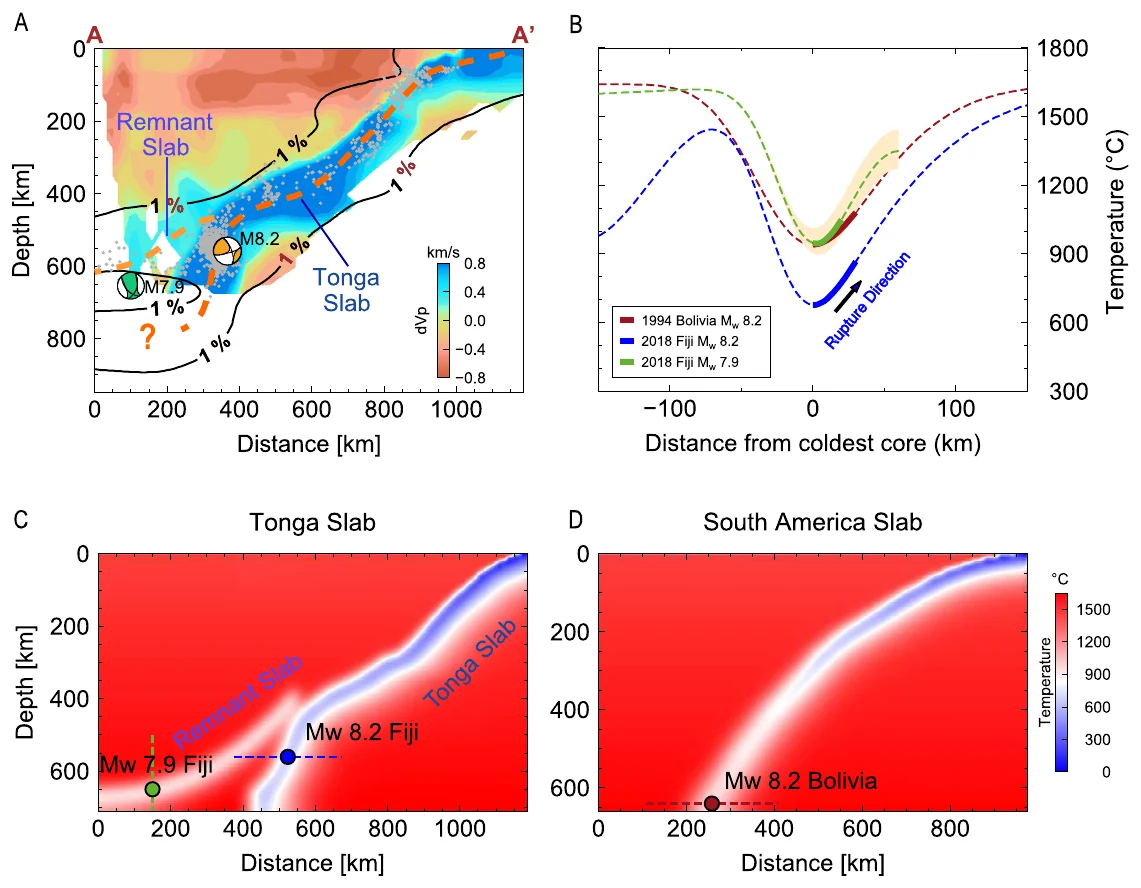
Subevent models of the two earthquakes. Most of the magnitude 8.2 rupture happened northeast of its start, in warmer rock.Seismic images and thermal models show two slabs. The magnitude 8.2 struck the warm edge of the Tonga slab and the 7.9 a relic slab above it.
Aug–Sep 2018 · Mw 8.2 and 7.9 · 556 and 655 km deep

2018 Fiji deep earthquake doublet

Jia, Z., Shen, Z., Zhan, Z., Li, C., Peng, Z., & Gurnis, M. (2020). The 2018 Fiji Mw 8.2 and 7.9 deep earthquakes: One doublet in two slabs. Earth and Planetary Science Letters.

In 2018, two great deep earthquakes struck beneath Fiji: a magnitude 8.2 at about 556 km depth in August, and three weeks later a magnitude 7.9 about 250 km to the west at about 655 km depth. They were the first pair of magnitude 8 class deep earthquakes on record. The Fiji–Tonga slab is the coldest on Earth. It produces more than 75% of the world's cataloged deep earthquakes, and none of the ten largest of the past century.

We measured the energy each earthquake radiated, determined the faulting from P-wave first motions, and split each rupture into subevents. We compared the results with aftershocks, seismic tomography, and thermal models. Both ruptures were compact, similar to the 1994 Bolivia deep earthquake in a much warmer slab. The magnitude 8.2 started near the cold core of the Tonga slab and did most of its rupturing in the warmer edge of the slab, at about 900 °C. The magnitude 7.9 occurred in a separate, warmer relic slab lying on top of the Tonga slab. The magnitude 8.2 had more than 400 aftershocks above magnitude 4 in 80 days, more than any deep earthquake before it.

Main findingLocal temperature inside the slab is the main control on how deep earthquakes rupture. The doublet also revealed two slabs interacting beneath Tonga.
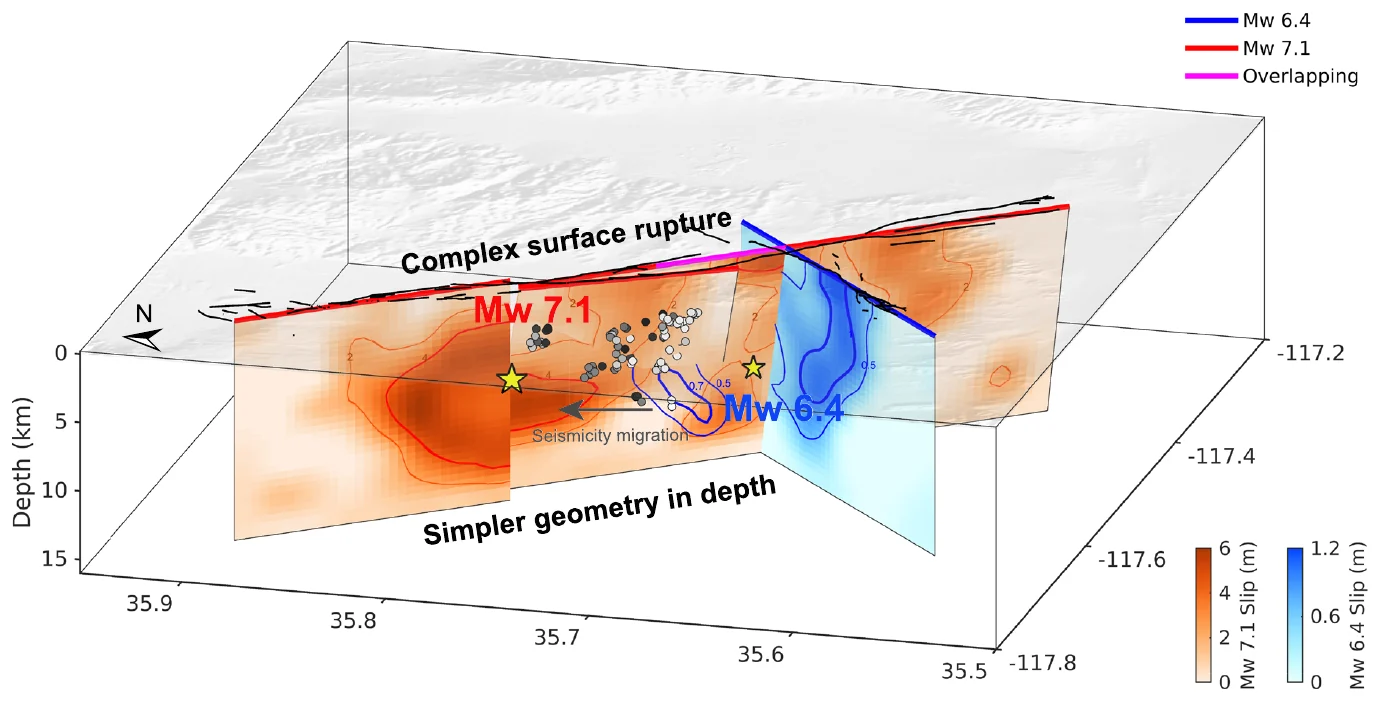
The faults beneath Ridgecrest in 3D. The foreshock (blue) and mainshock (orange) slipped on neighboring patches, and the complex surface rupture becomes simpler at depth.
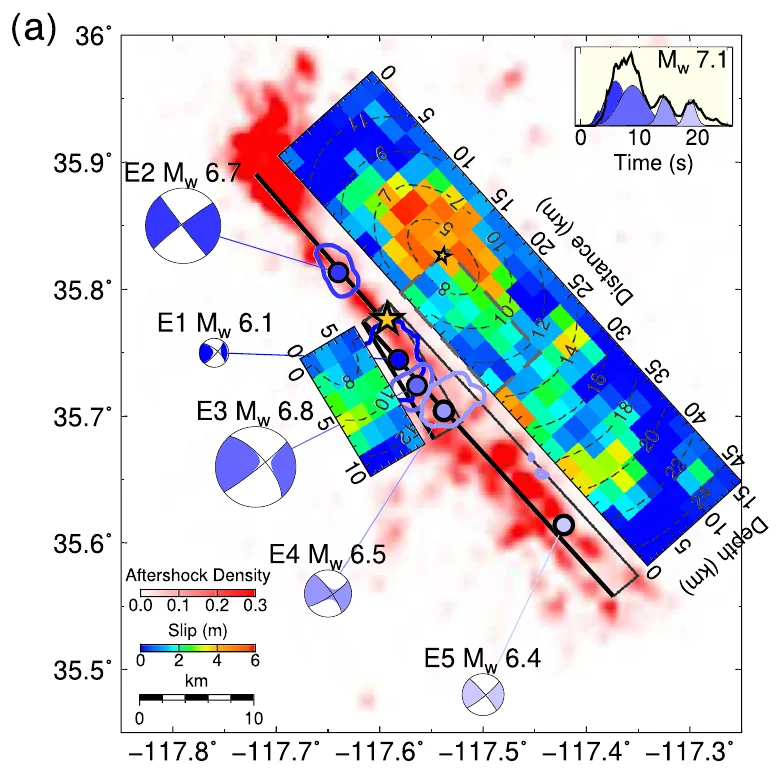
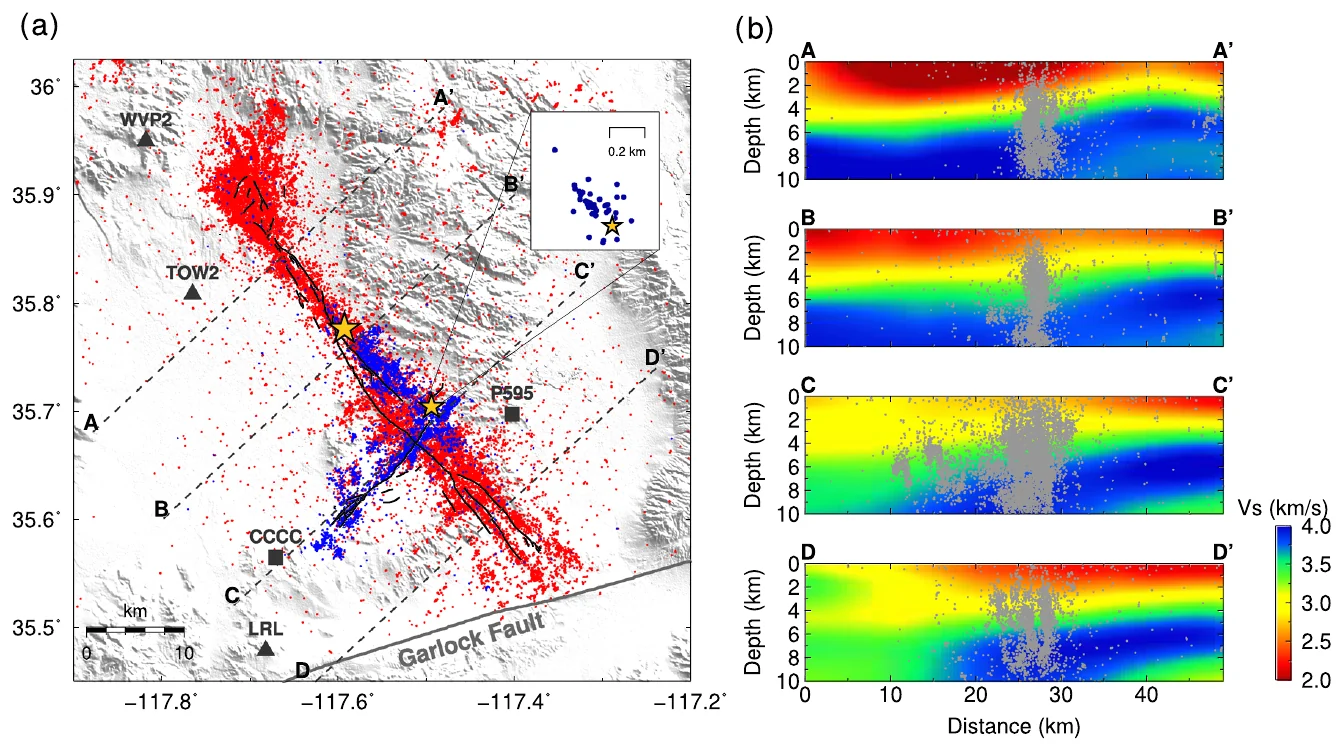
The magnitude 7.1 broke as five subevents, with up to about 6 m of slip on the main fault.Aftershocks outline the crossing faults. Side panels show the 3D crustal model used to simulate the waves.
Jul 2019 · Mw 6.4 and 7.1

2019 Ridgecrest, California: multi-fault rupture models

Jia, Z., Wang, X., & Zhan, Z. (2020). Multifault models of the 2019 Ridgecrest sequence highlight complementary slip and fault junction instability. Geophysical Research Letters.

In July 2019, a magnitude 6.4 foreshock struck near Ridgecrest, California, and a magnitude 7.1 mainshock followed 34 hours later. The ground broke along a tangle of crossing faults, and the surface cracks and the aftershocks gave different pictures of which faults slipped at depth. We first represented each earthquake as a few subevents and used them to set up multi-fault slip models. The models fit strong-motion and global seismic records, high-rate GPS, and satellite radar, with seismic waves simulated through a 3D model of the Southern California crust.

The foreshock started where two perpendicular faults meet and ruptured both of them in about 10 seconds. Small earthquakes then migrated northwest toward a junction of three faults, where the mainshock began. The mainshock slipped up to about 6 m at depth. Four faults explain all the data, and the complex surface rupture merges into a simpler fault at depth.

Main findingOn the fault section they share, the foreshock and mainshock slipped on complementary patches. The mainshock started at a three-fault junction, which points to fault junctions as weak spots where large multi-fault earthquakes begin.
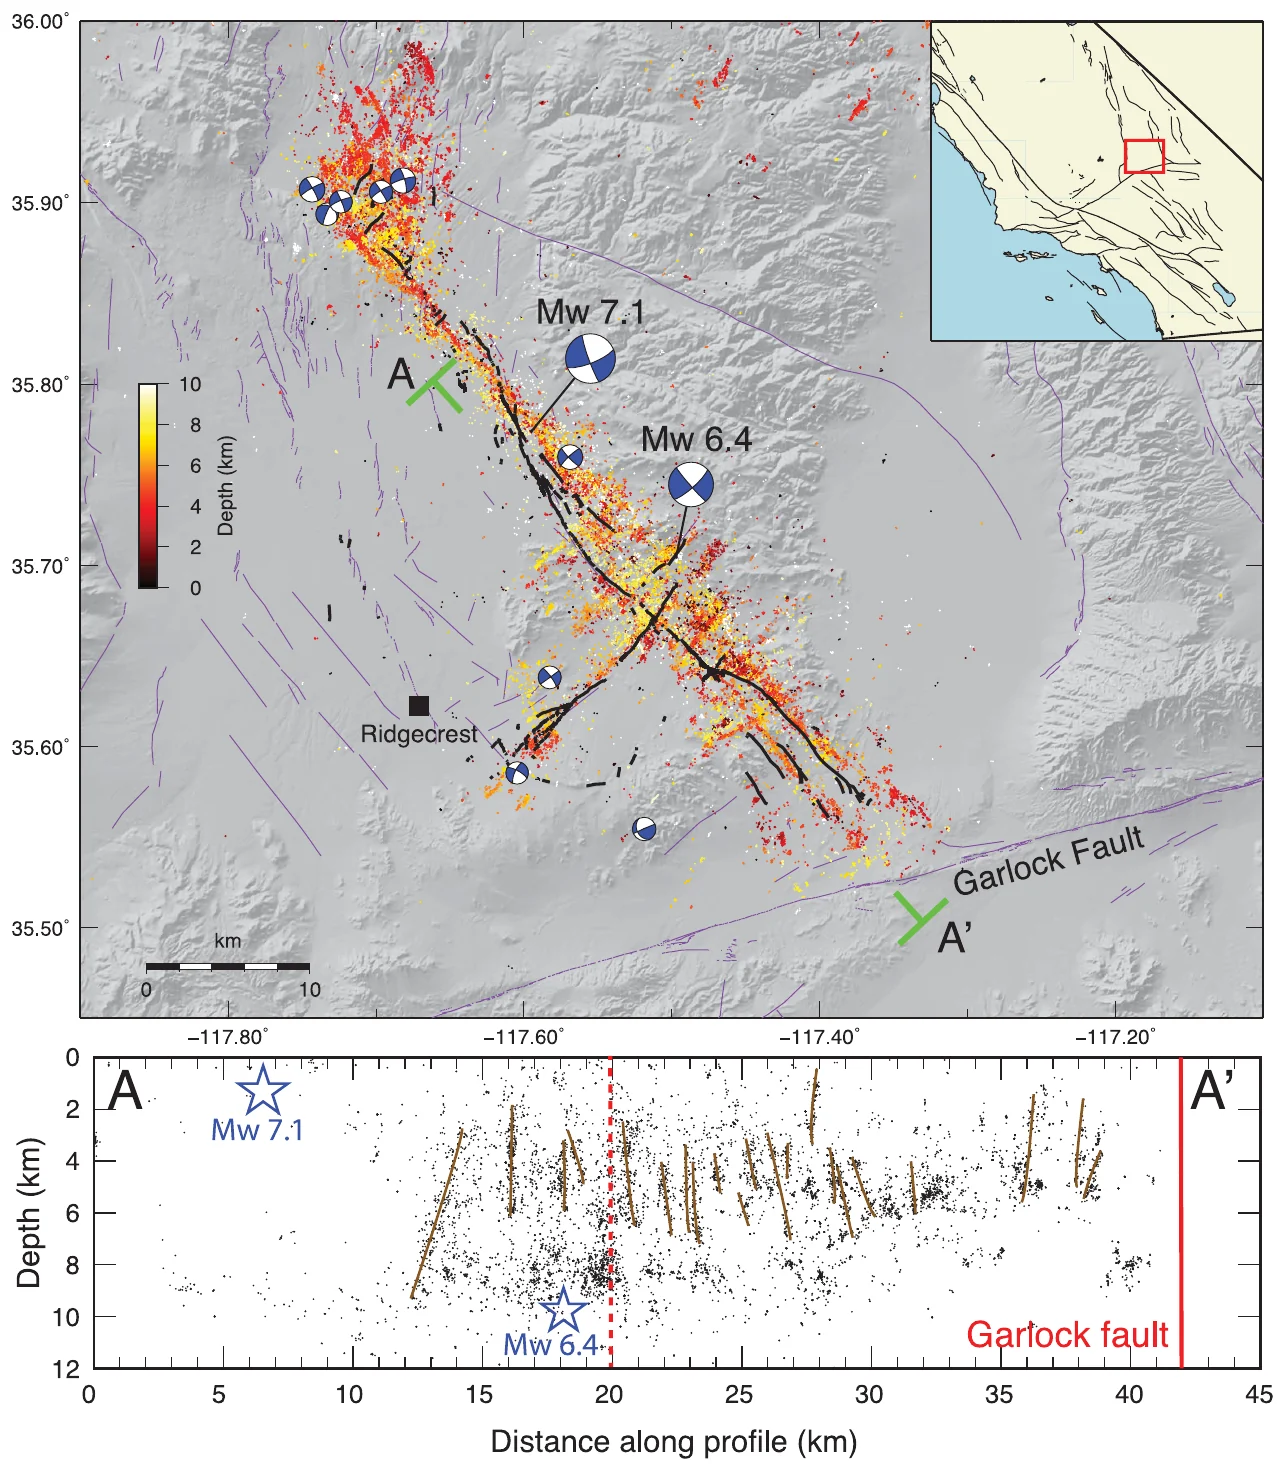
Precisely located earthquakes, colored by depth, outline faults that cross at right angles. The section below shows at least 20 cross-cutting faults.
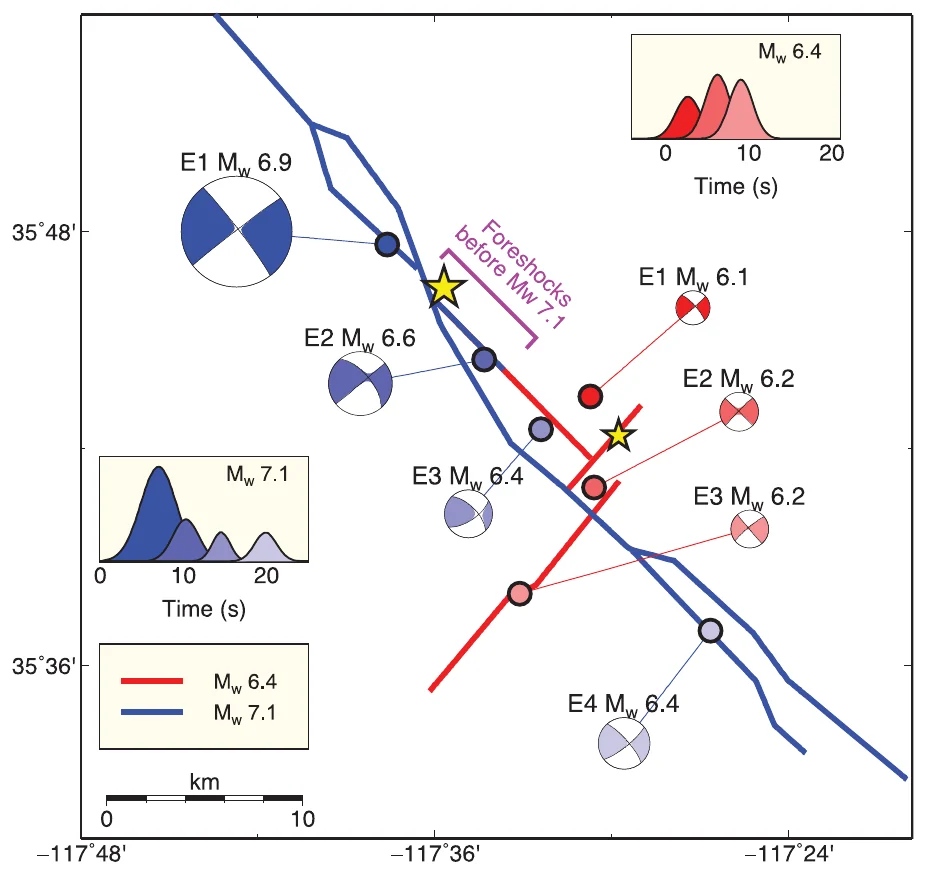
Subevent models: the magnitude 6.4 (red) broke in three bursts over about 12 seconds and the magnitude 7.1 (blue) in four bursts over about 22 seconds.
Jul 2019 · Mw 6.4 and 7.1

2019 Ridgecrest, California: a web of orthogonal faults

Ross, Z. E., Idini, B., Jia, Z., Stephenson, O. L., Zhong, M., Wang, X., Zhan, Z., Simons, M., et al. (2019). Hierarchical interlocked orthogonal faulting in the 2019 Ridgecrest earthquake sequence. Science.

The Ridgecrest sequence ended a 20-year pause in large earthquakes in Southern California. This study combined a catalog of small earthquakes located to about 100 m, satellite radar maps of deformation and surface damage, GPS, and models of the two largest earthquakes as sequences of subevents. I carried out the subevent modeling with Xin Wang and Zhongwen Zhan.

The sequence broke a previously unmapped web of faults that cross at right angles, from about 1 km to more than 10 km long, through the upper 10 km of the crust. At least 20 faults about 2 km or longer ruptured. The magnitude 6.4 broke at least three faults in about 12 seconds. The magnitude 7.1 ruptured for about 22 seconds in four bursts at about 2 km/s and stopped less than 5 km from the Garlock fault.

Main findingLarge earthquakes can break many interlocking faults at once, so hazard estimates that treat faults one at a time need rethinking.
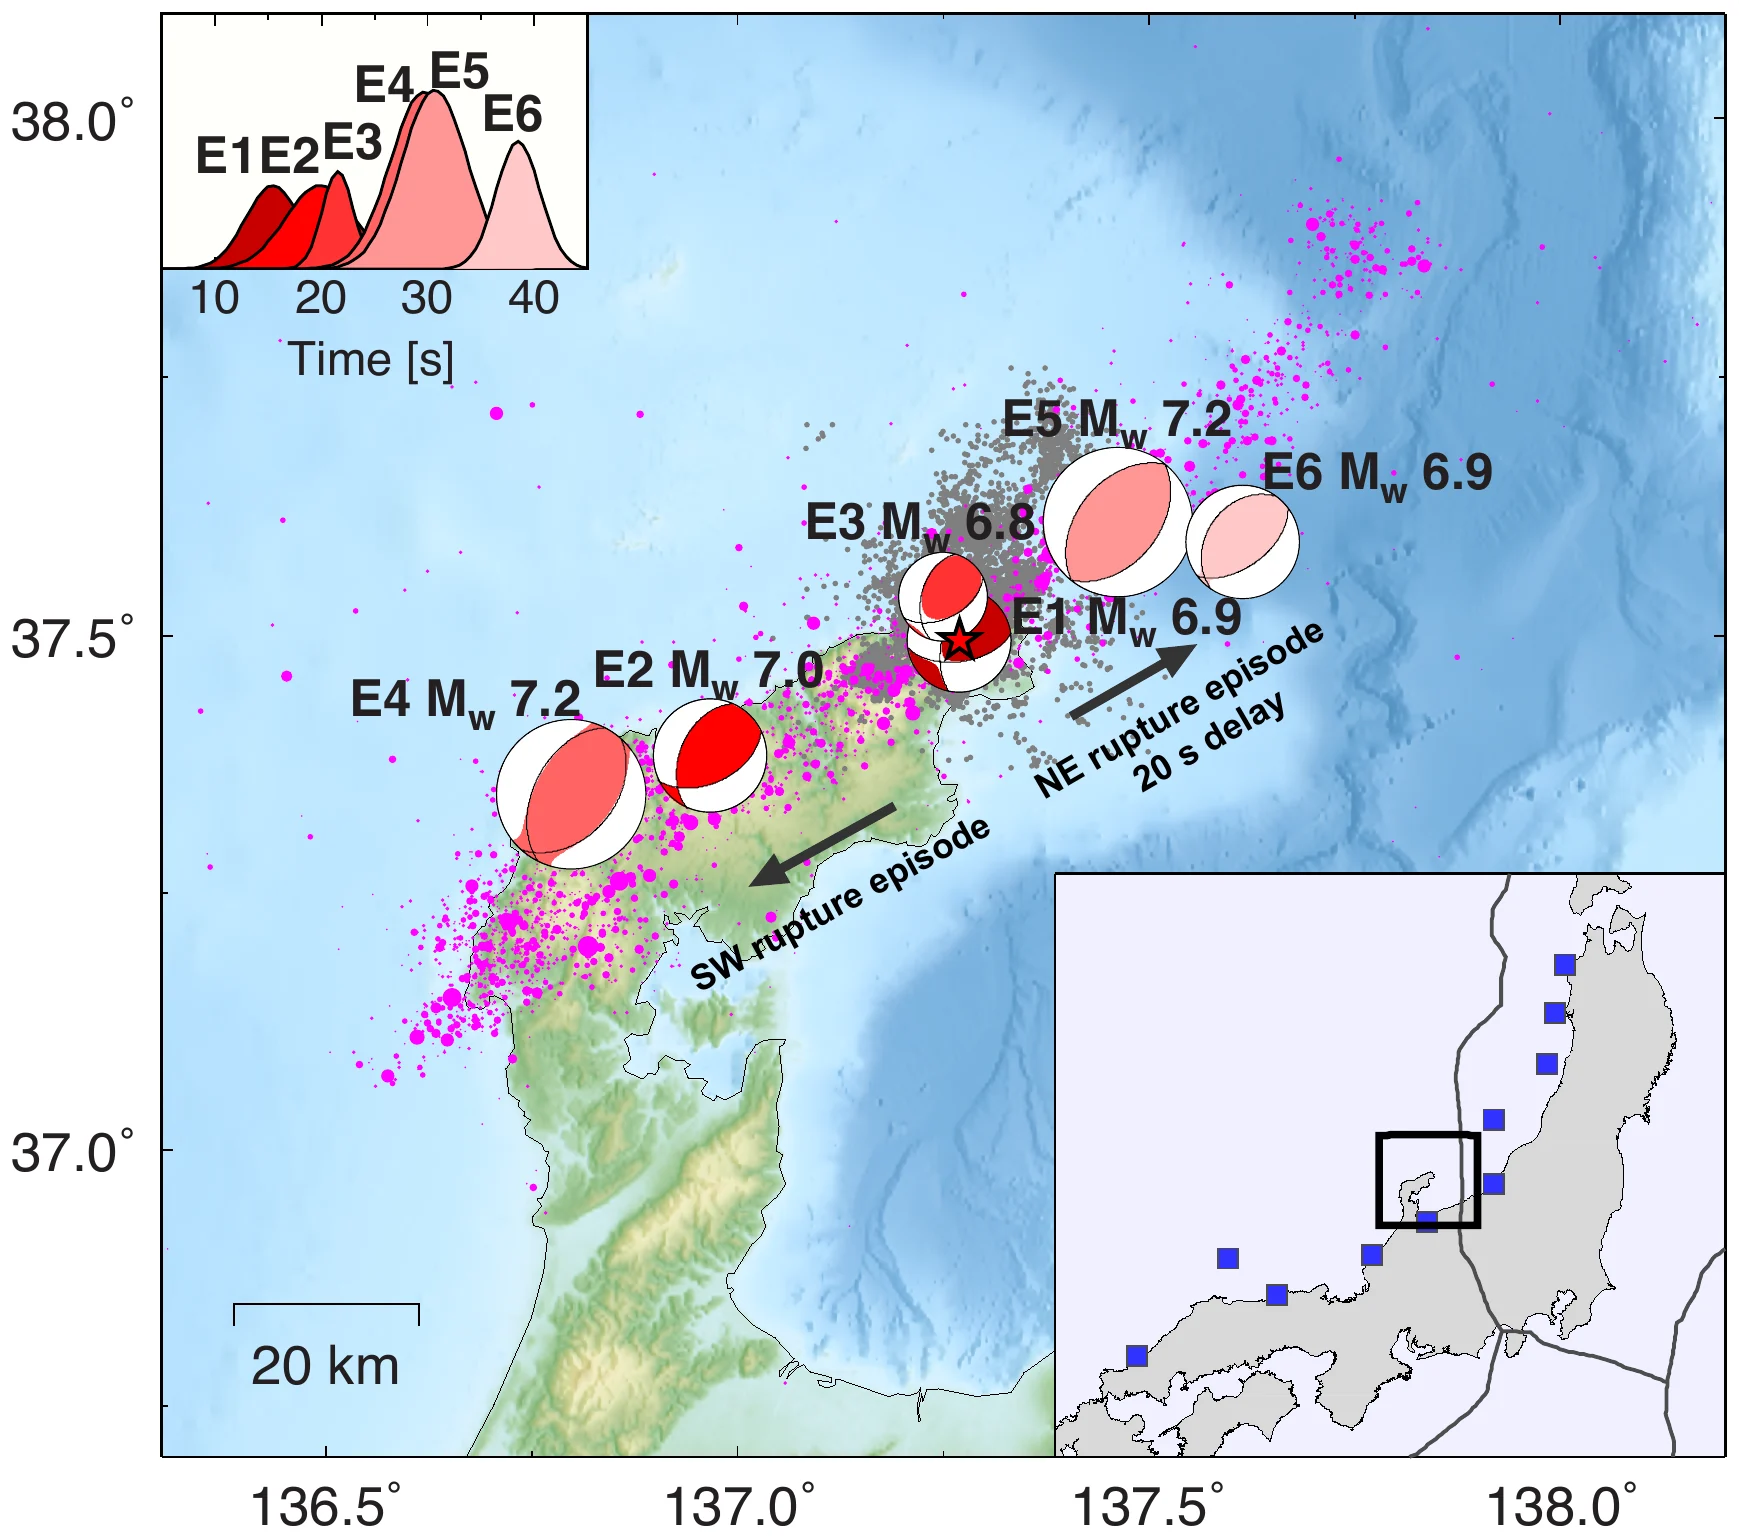
Six subevents, darker for earlier. The rupture ran southwest first, then northeast offshore after a 20-second pause.
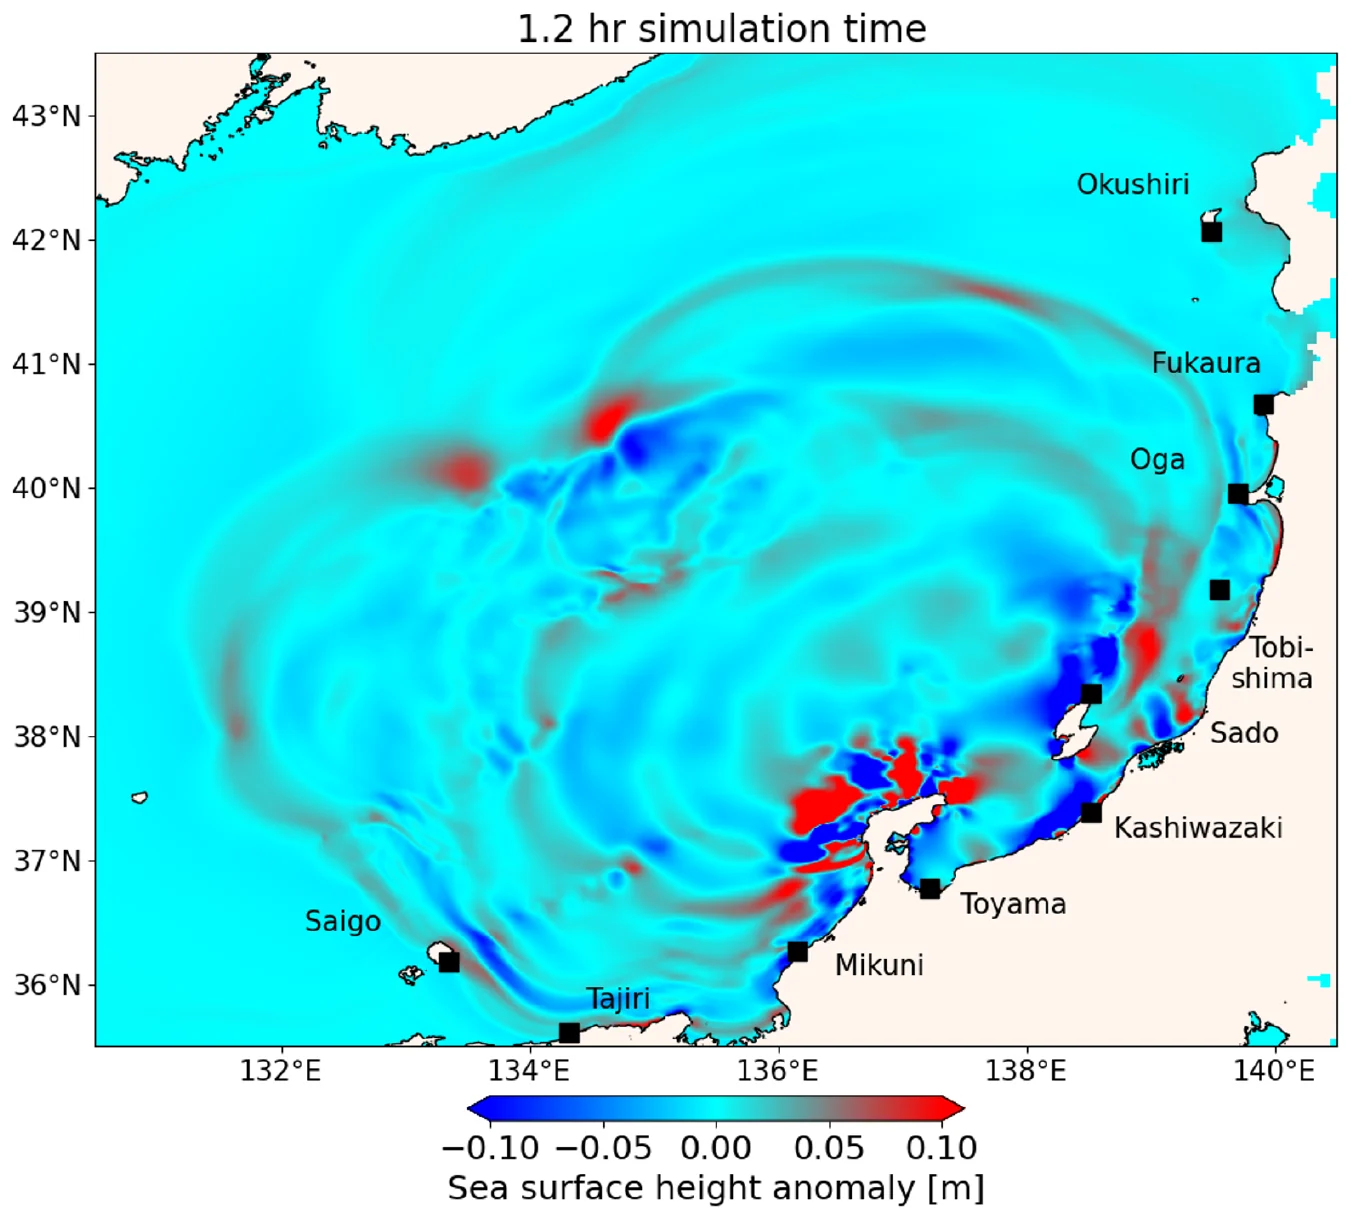
Simulated tsunami across the Sea of Japan 1 hour 12 minutes after the earthquake. Black squares mark the tide gauges used to check the model.
Jan 2024 · Mw 7.5

2024 Noto Peninsula, Japan, earthquake and tsunami

Kutschera, F., Jia, Z., Oryan, B., Wong, J. W. C., Fan, W., & Gabriel, A.-A. (2024). The multi-segment complexity of the 2024 Mw 7.5 Noto Peninsula earthquake governs tsunami generation. Geophysical Research Letters.

On 1 January 2024, a magnitude 7.5 earthquake struck Japan's Noto Peninsula and sent a tsunami across the Sea of Japan. Early models disagreed on how much of the fault slipped offshore, which is what drives a tsunami. A Bayesian multi-subevent inversion of seismic waves from 93 distant stations and nearby strong-motion stations described the earthquake as six subevents. The rupture first ran southwest along the peninsula for about 30 seconds. After a 20-second delay it restarted near its starting point and ran northeast, mostly offshore. This second episode released 40% of the moment and lifted the seafloor by up to about 3.8 m.

The seafloor uplift from the subevent model then drove tsunami simulations. The simulated arrival times matched nine tide gauges to within 1 to 3.5 minutes, along with the direction and size of the first wave. The rapid USGS models could not explain the observed amplitudes and timing.

Main findingThe tsunami depends on the multi-segment rupture. A rapid subevent model reproduces it well enough to support tsunami early warning.
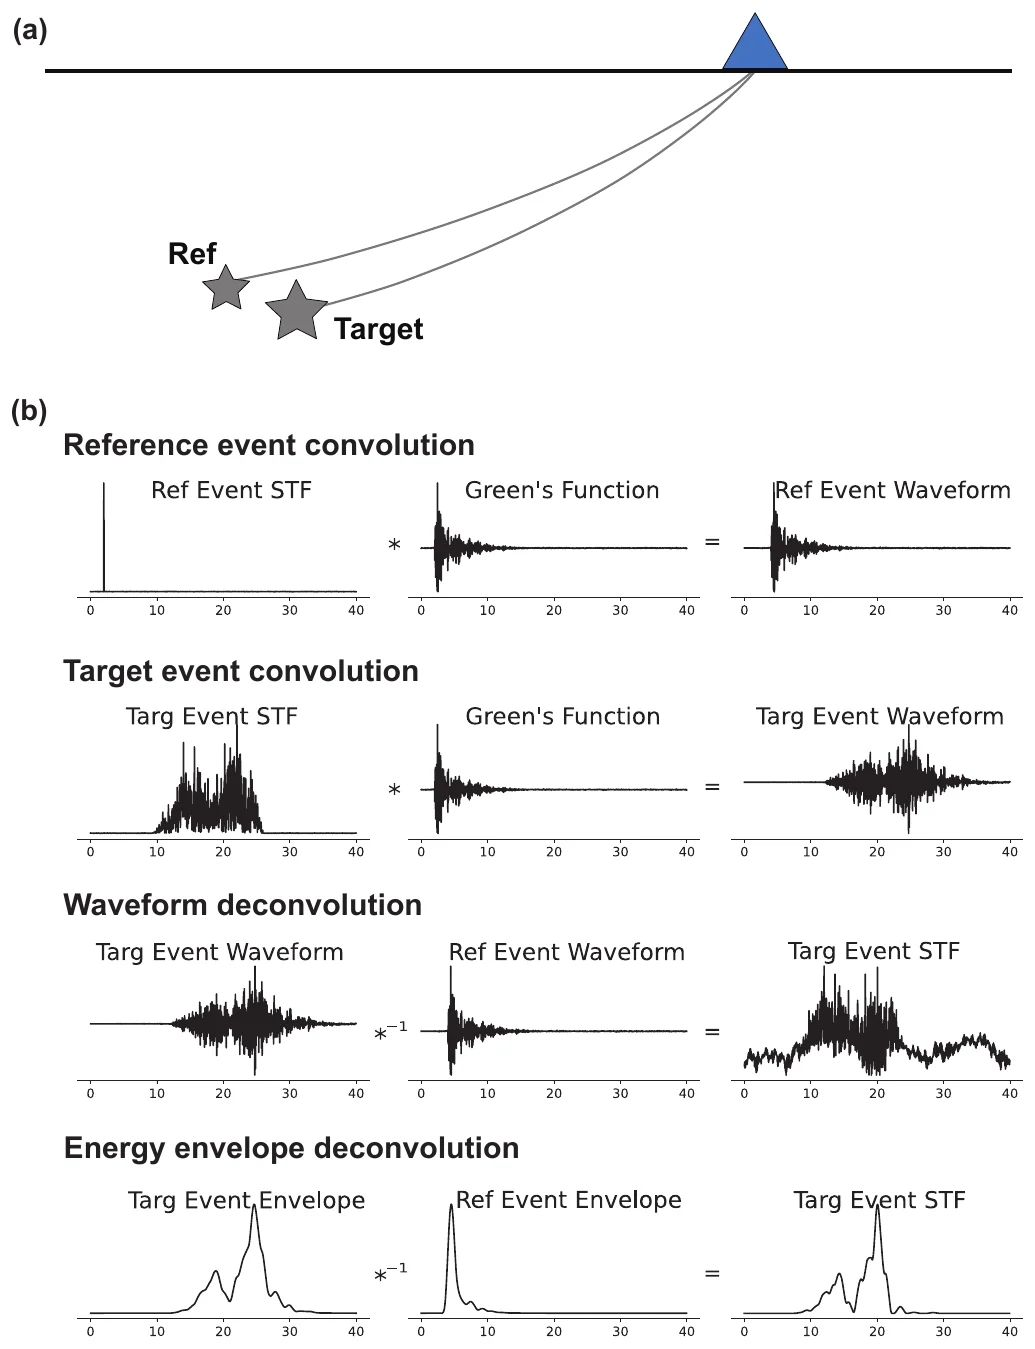
A small earthquake on the same path removes path effects from a larger one. Deconvolving energy envelopes (bottom) recovers the source history more cleanly than deconvolving waveforms.
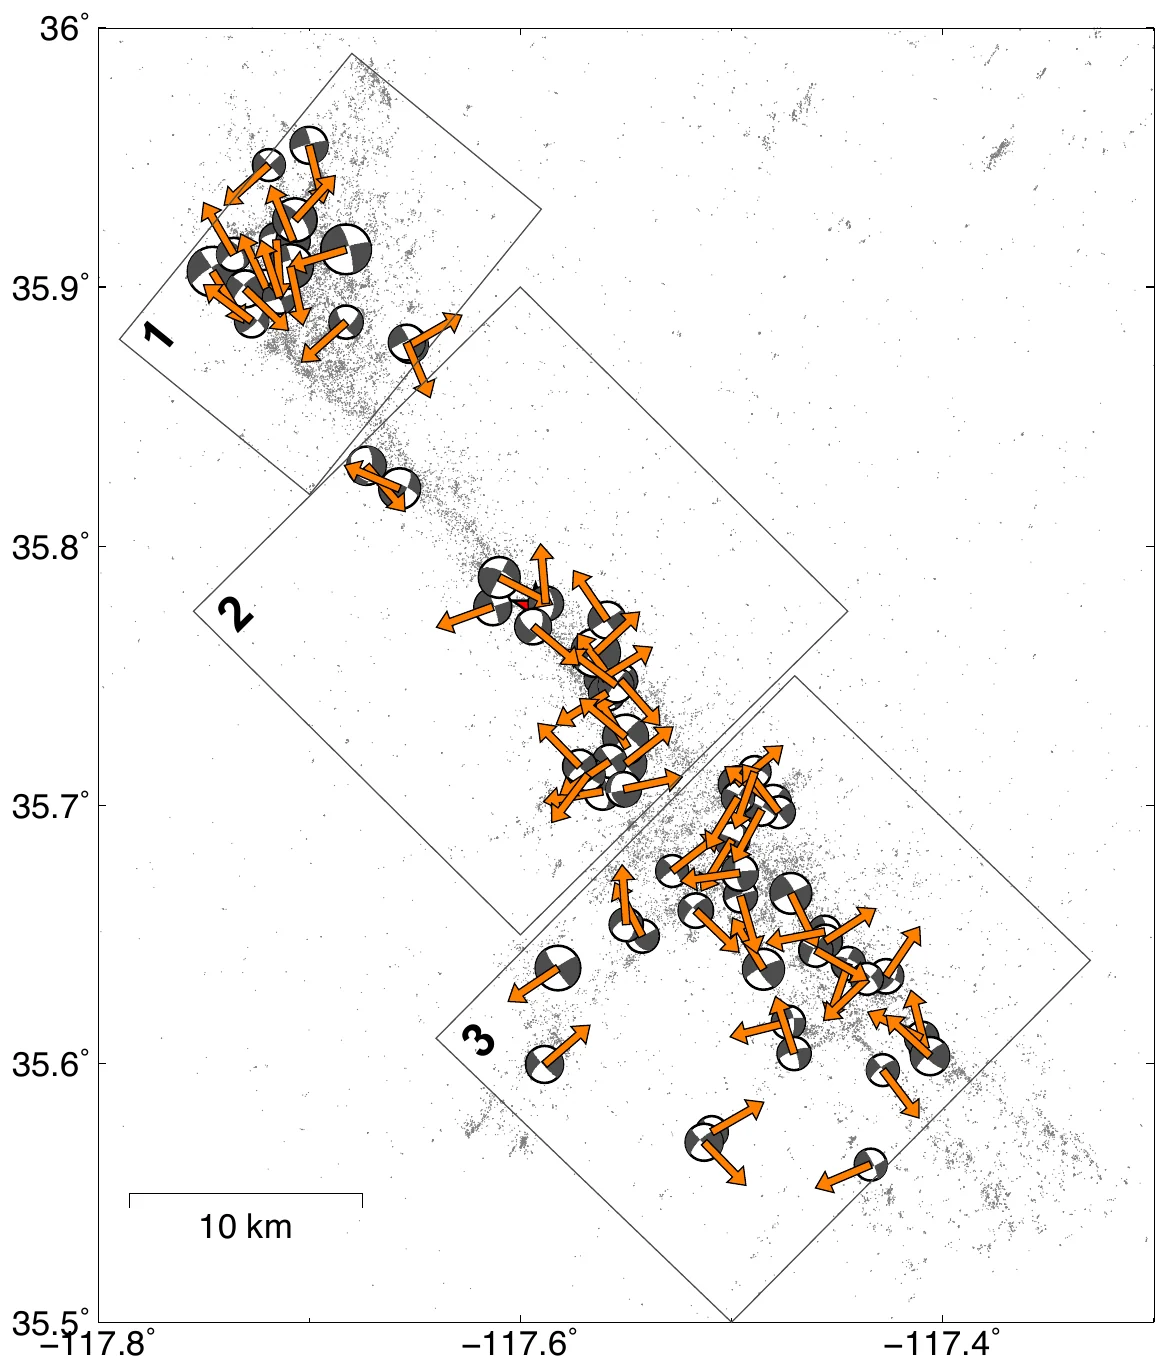
Arrows show the rupture direction of each analyzed Ridgecrest earthquake (map from the preprint version).
2019 Ridgecrest aftershocks · M 3.5–5.5

Rupture directivity of small earthquakes

Jia, Z., Shearer, P. M., & Fan, W. (2026). Rupture directivity from energy envelope deconvolution: Theory and application to 58 Ridgecrest M 3.5–5.5 earthquakes. Journal of Geophysical Research: Solid Earth.

A rupture often runs mainly in one direction. Stations it runs toward record shorter pulses than stations behind it, similar to the Doppler effect. This is easy to measure for large earthquakes and hard for small ones, whose pulses are brief and smeared by scattering at the high frequencies needed to see them.

The method compares each target earthquake with smaller nearby earthquakes whose waves travel the same paths. It deconvolves the smooth energy envelopes of the shear waves, which are stable at 5 to 10 Hz. We tested it on synthetic data and applied it to 58 magnitude 3.5 to 5.5 earthquakes of the 2019 Ridgecrest sequence. Their rupture directions outline an interlocking network of crossing faults that matches the aftershock locations, and the pattern appears to correlate with spatial differences in stress drop.

Main findingEnergy envelopes make it possible to measure rupture directivity for much smaller earthquakes, which gives many more events for mapping hidden fault structure.
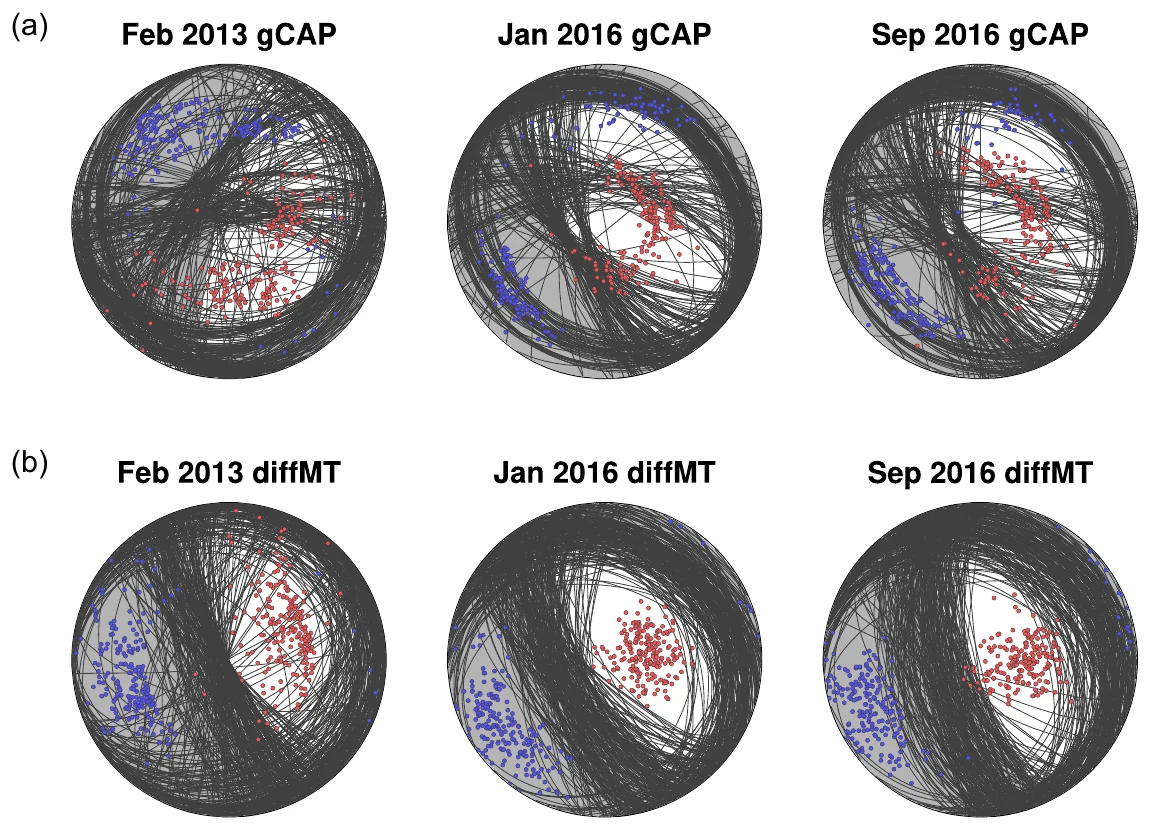
Each curve is one plausible fault orientation. The conventional method (top) leaves them scattered, and the differential method (bottom) brings them together.
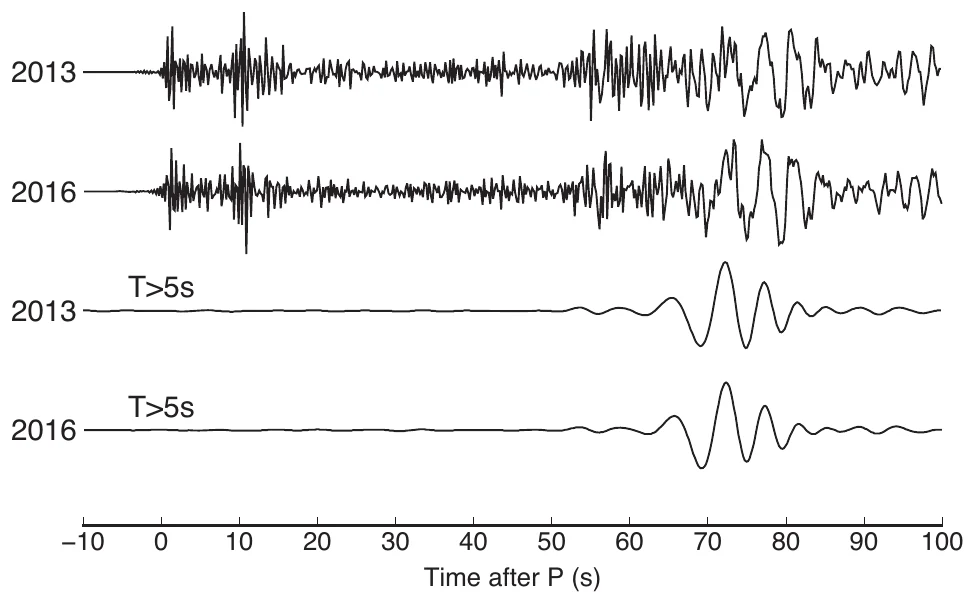
Two tests three years apart produced nearly identical seismograms at a station about 400 km away.
2013 and 2016 · Mw 4.3–4.4

North Korea nuclear tests

Jia, Z., Zhan, Z., & Helmberger, D. (2022). Bayesian differential moment tensor inversion: Theory and application to the North Korea nuclear tests. Geophysical Journal International.

Seismic waves can tell an underground explosion from an earthquake: an explosion pushes outward in all directions, and an earthquake slips along a fault. Estimating this source description, the moment tensor, normally needs an accurate model of how waves travel through the Earth, and errors in that model blur the answer. North Korea's tests were all set off within a few kilometers of each other, so their waves follow nearly the same paths to each station.

We compared the tests in pairs. Dividing one test's wave amplitudes by another's at the same station cancels most of the shared path and site effects. We measured these ratios for P waves and surface waves and used Bayesian Markov chain Monte Carlo sampling to find all source models consistent with them. For the February 2013, January 2016, and September 2016 tests, the uncertainties shrank substantially. The explosive share came out at 88% to 92%, compared with 44% to 66% in the conventional solutions.

Main findingDifferential measurements between nearby events remove most of the path error and give much sharper source estimates, which helps identify explosions and compare their sizes.
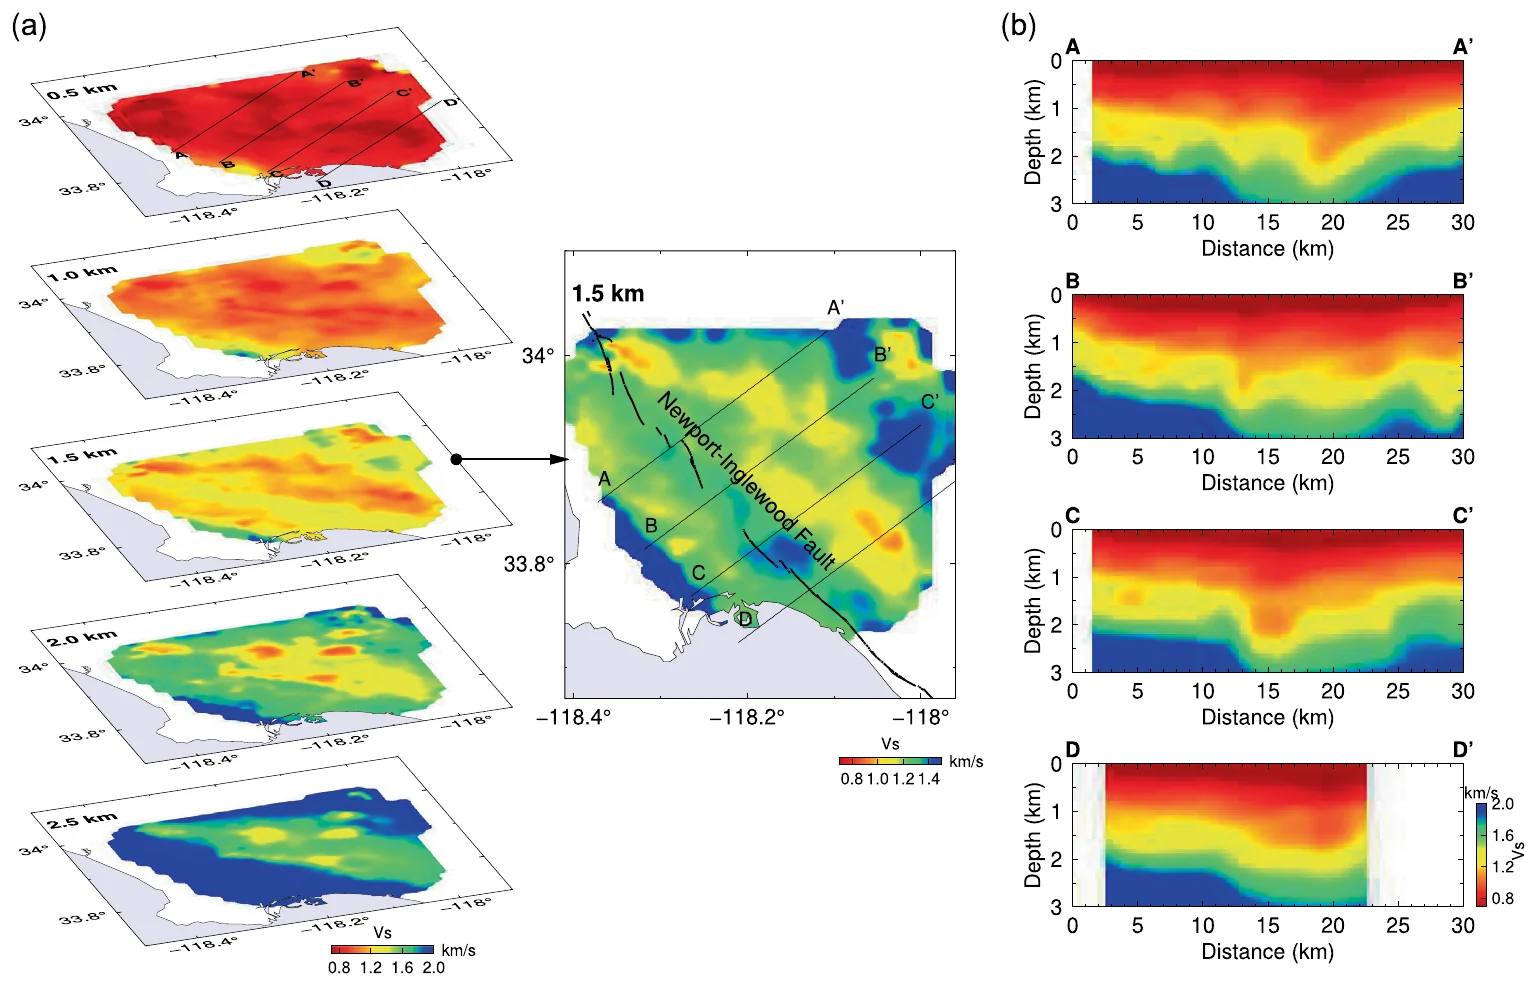
Shear-wave speed from 0.5 to 2.5 km depth: red is slow sediment and blue is fast rock. At 1.5 km a fast belt follows the Newport–Inglewood fault.
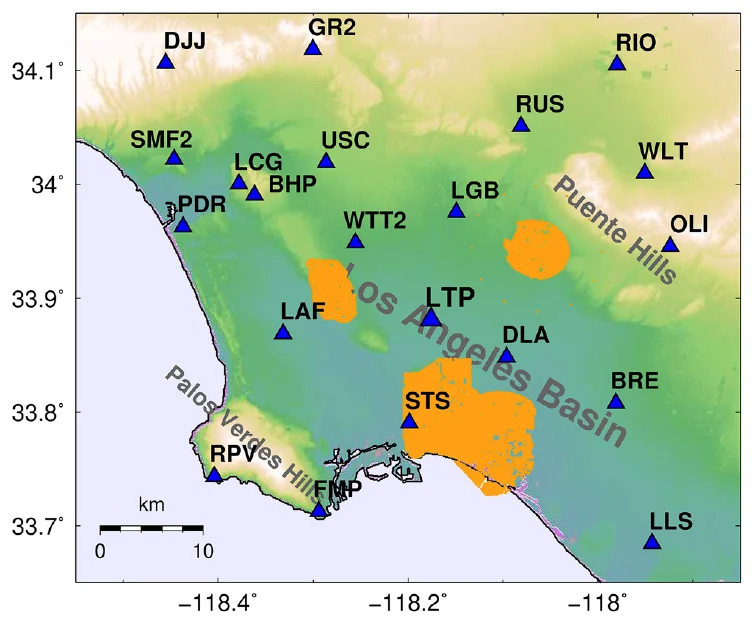
21 permanent seismometers (triangles) and five dense industry arrays (orange) with more than 16,000 sensors.
5 dense arrays · 16,000+ sensorsJGR cover

Shallow structure of the Los Angeles Basin

Jia, Z., & Clayton, R. W. (2021). Determination of near surface shear-wave velocities in the central Los Angeles Basin with dense arrays. Journal of Geophysical Research: Solid Earth.

Los Angeles sits on a deep sedimentary basin whose soft near-surface layers amplify earthquake shaking, and the shaking can change by a factor of five within a kilometer. The basin has only about 20 permanent broadband seismometers. Between 2011 and 2018, oil companies deployed five temporary dense arrays with more than 16,000 sensors, and they recorded the Earth's constant background vibration while 21 regional stations were also recording.

Cross-correlating this ambient noise between each regional station and each array sensor produces surface waves that appear to travel between them, and the way their speed changes with frequency reveals how stiff the ground is at each depth. From 353,006 correlations we built a 3D model of shear-wave velocity in the top 3 km of the central basin. It resolves finer structure than the community velocity models and fits the data better, and it shows a belt of fast rock along the Newport–Inglewood fault.

Main findingIndustry dense arrays and ambient noise give a high-resolution model of the shallow Los Angeles Basin, which can improve predictions of strong shaking.
More studies

Methods, collaborations, and earlier work

Jul 2025 · Mw 8.8

2025 Kamchatka megathrust earthquake

A magnitude 8.8 earthquake struck off Kamchatka about 50 km from the start of the 1952 magnitude 9.0 earthquake. Combining global seismic waves with tsunami records, PhD student Junpeng Li and I found that most slip was at moderate to greater depth in the southwest, where few earthquakes had occurred since 1952. Peak slip of about 14 m exceeds the roughly 6 m of slip deficit built up since 1952, so the 2025 earthquake released a deeper patch that likely stayed locked in 1952.

Li, J., & Jia, Z. (2026), Geophysical Research Letters. Paper

Sep 2022 · Mw 6.6

2022 Luding, China, earthquake

Published depths of the deadliest earthquake in mainland China in eight years ranged from 2 to 18.4 km. Regional data favor about 6 km and teleseismic data about 17 km. Both fit a two-subevent model: a larger shallow subevent at about 6 km and, 7 seconds later, a smaller one at about 17 km.

Han, H., Ni, S., Meng, Q., Gu, W., Jia, Z., et al. (2026), Bulletin of the Seismological Society of America. Paper

3D geodynamic model

Slab dynamics and earthquakes in Izu-Bonin-Mariana

A 3D model of the sinking Pacific slab predicts temperature, stress, and energy dissipation. Earthquakes occur mostly in rock cooler than about 900 °C, where dissipation is high, and the modeled stresses explain megathrust, outer-rise, and deep bending earthquakes. Shallow events favor a weak slab and deep events a stronger slab with a 10 to 100 fold viscosity increase at 660 km.

Li, Y., Ribe, N. M., & Jia, Z. (2026), Earth and Planetary Science Letters. Paper
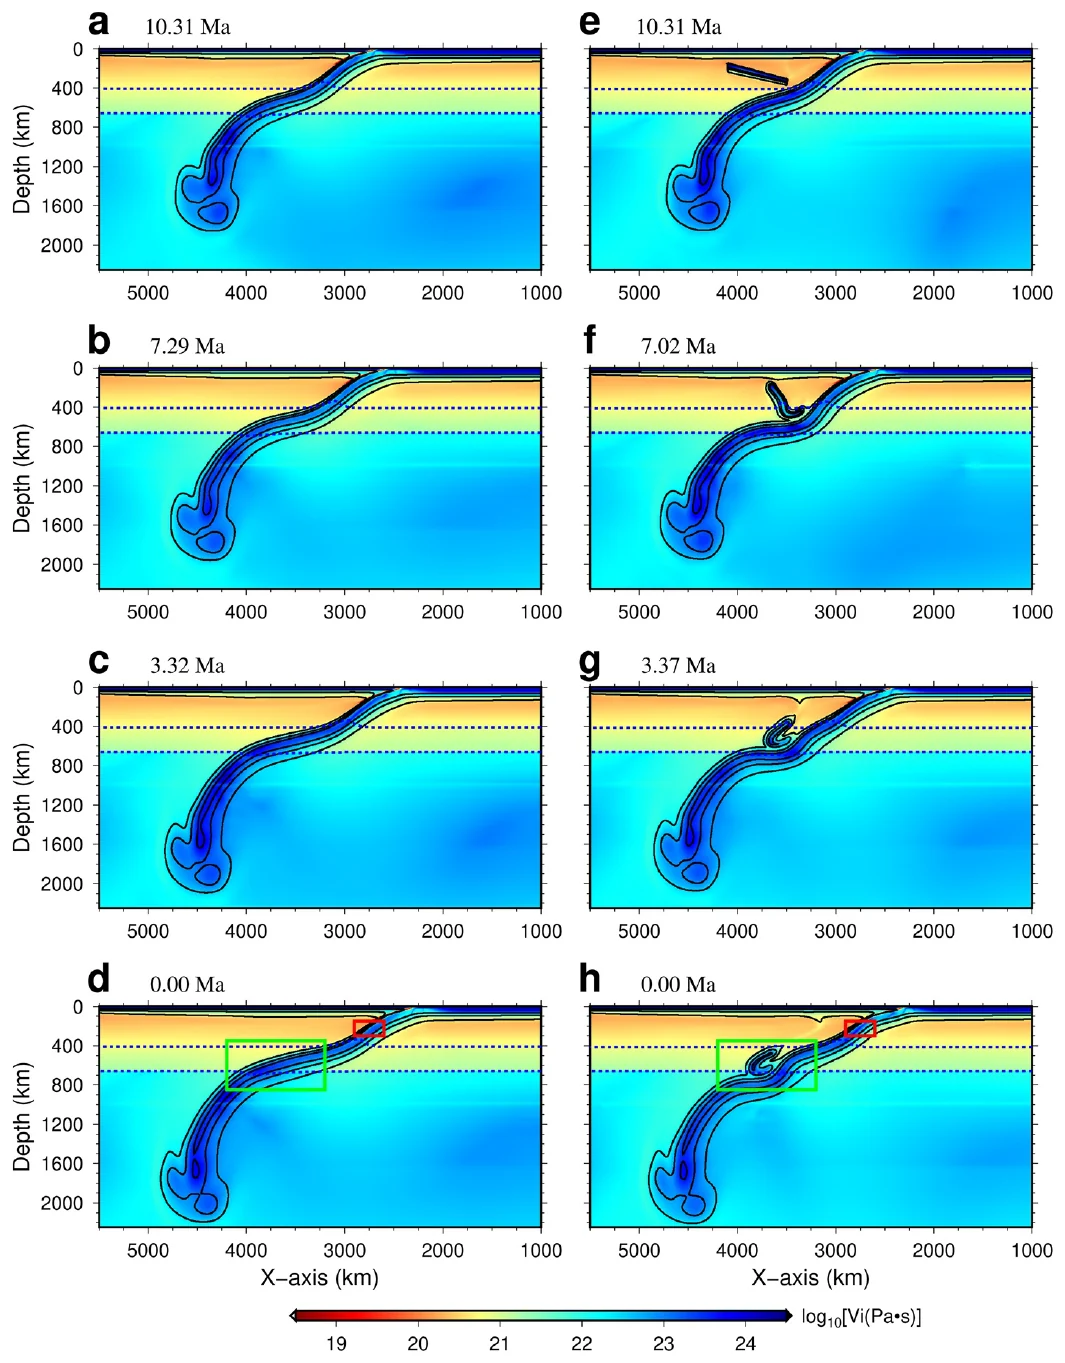
Figure from the study: The Tonga slab and a relic slab
Tonga–Fiji · mantle flow models

The Tonga slab and a relic slab

About two-thirds of the world's deep earthquakes occur in the Tonga slab. Mantle flow models that follow the region's plate history show a relic slab from the Vanuatu trench colliding with the Tonga slab, folding over it, and steepening it, which reproduces the stresses seen in deep earthquakes. The models imply that the 2018 Fiji doublet broke warm slab rock, which supports local slab temperature as the control on deep ruptures.

Liu, H., Gurnis, M., Leng, W., Jia, Z., & Zhan, Z. (2021), Geophysical Research Letters. Paper · PDF
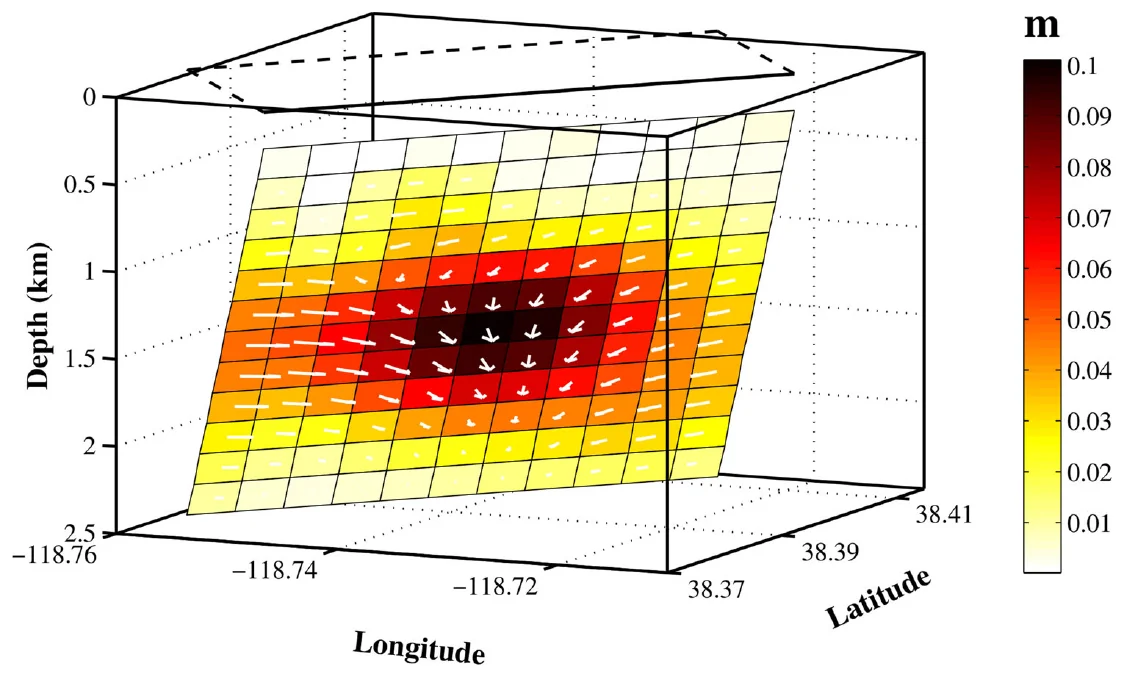
Figure from the study: 2011 Hawthorne, Nevada, earthquake swarm
Mar–Aug 2011 · Mw 3.9–4.8

2011 Hawthorne, Nevada, earthquake swarm

A swarm of 71 earthquakes shook an area near a Navy base and young volcanic features. Waveform modeling put the nine largest at 2 to 4 km depth with normal faulting, and satellite radar showed up to 10 cm of slip at 1 to 2 km depth. The radar implies about 15% more slip than the earthquakes released, and the swarm likely came from slow fault slip under regional stretching, with no sign of volcanic activity.

Zha, X., Jia, Z., Dai, Z., & Lu, Z. (2019), Journal of Geodesy. Paper · PDF
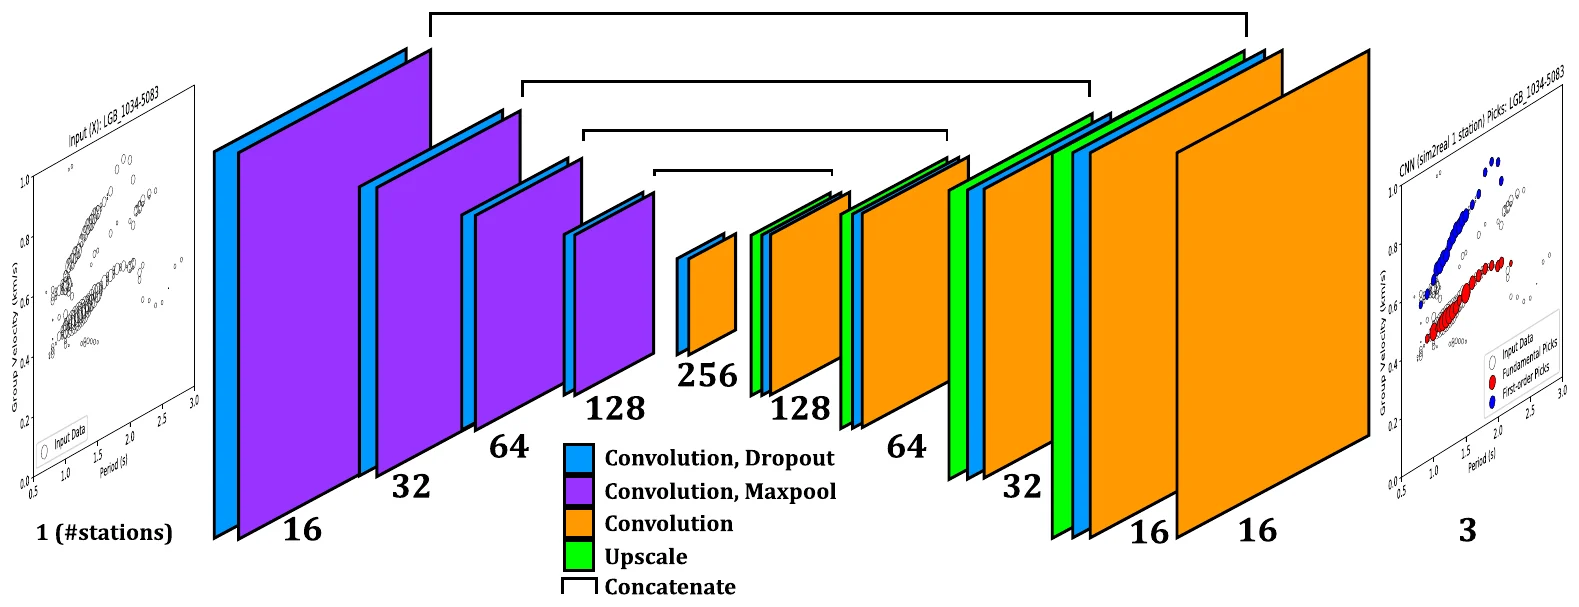
Figure from the study: Deep learning for ambient-noise dispersion curves
U-Net · Long Beach dense array

Deep learning for ambient-noise dispersion curves

Dense arrays produce thousands of dispersion images that analysts trace by hand. A U-Net trained on 100,000 synthetic curves and fine-tuned on 1,000 hand-labeled examples labels every pixel as fundamental mode, first overtone, or noise. On 4,340 held-out examples its picks match a human analyst's, with median precision of at least 98% and recall of at least 94%, and it cuts human labor by about 80%.

Zhang, X., Jia, Z., Ross, Z. E., & Clayton, R. W. (2020), IEEE Transactions on Geoscience and Remote Sensing. Paper · PDF
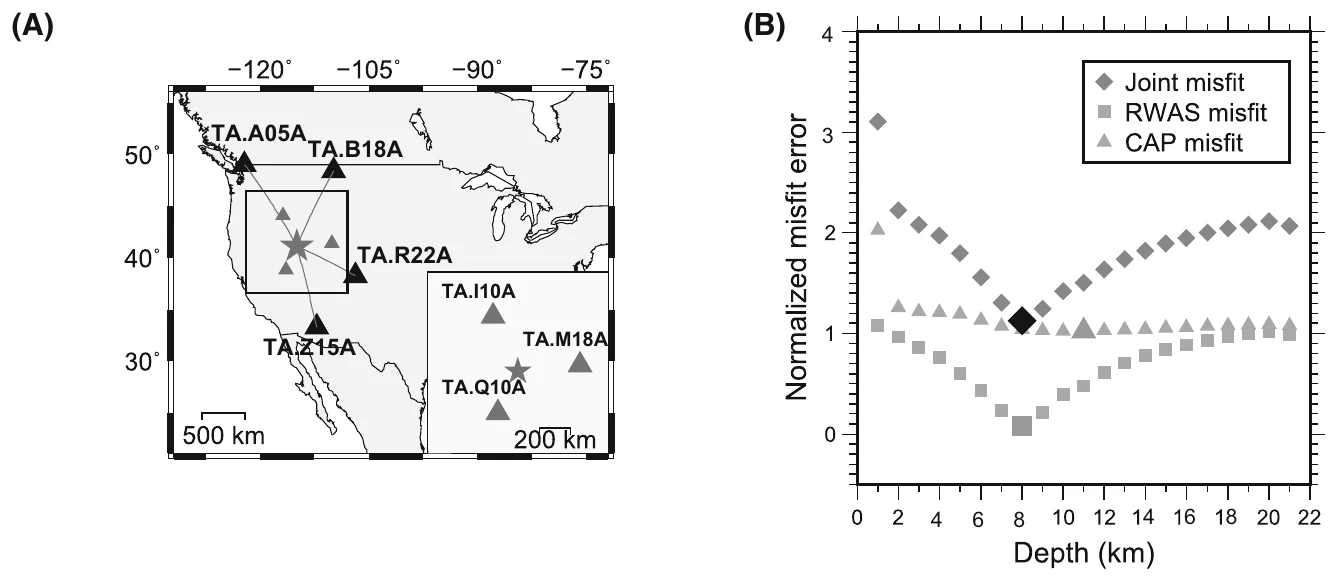
Figure from the study: Earthquake depth from sparse stations
2008 Wells, Nevada · Mw 6.0

Earthquake depth from sparse stations

With few nearby stations, waveform fits can match almost equally well over a wide range of depths. Rayleigh waves recorded 5 to 15 degrees away have spectral dips that shift with source depth. Fitting them together with local waveforms gave depths of 8 km for the 2008 Wells, Nevada, earthquake and 32 km for a 2013 outer-rise earthquake off Japan, both confirmed by teleseismic depth phases.

Jia, Z., Ni, S., Chu, R., & Zhan, Z. (2017), Pure and Applied Geophysics. Paper · PDF
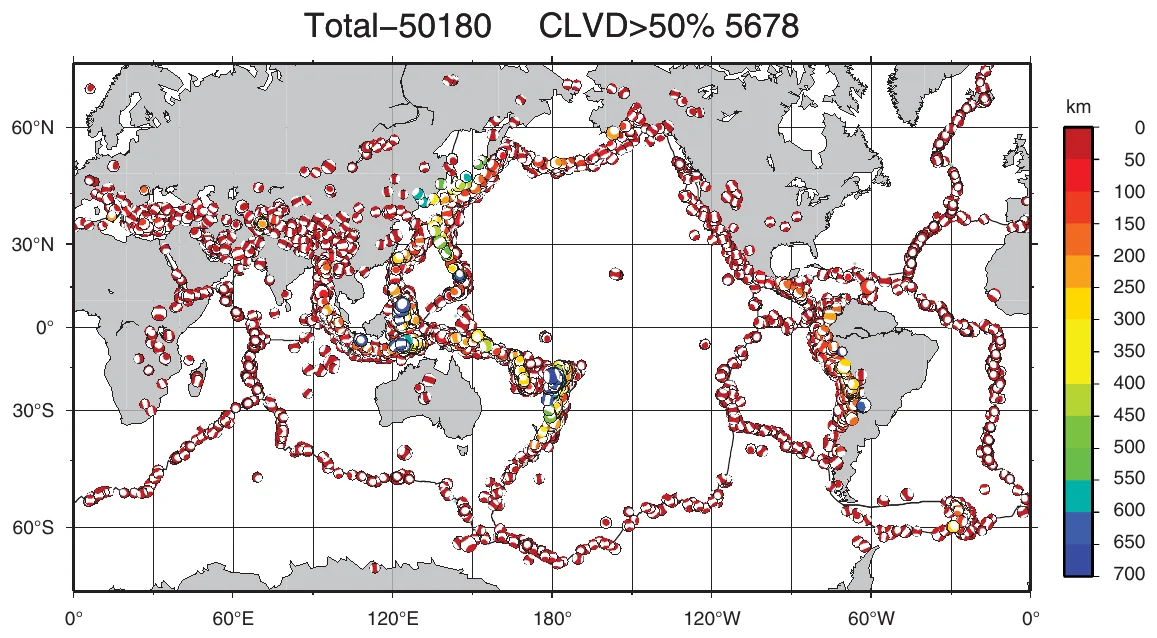
Figure from the study: gCAPjoint full moment tensor software
Software · local and teleseismic waveforms

gCAPjoint full moment tensor software

About 10% of earthquakes in the Global CMT catalog have large non-double-couple components. gCAPjoint solves for the full moment tensor and depth by fitting local and teleseismic waveforms together. Tests on the 2017 Jiuzhaigou, 2010 Jiashian, and 2016 Pamir earthquakes gave a shallow 6 km source for Jiuzhaigou with a non-double-couple share of up to 25%.

Bai, Q., Ni, S., Chu, R., & Jia, Z. (2020), Seismological Research Letters. Paper · PDF
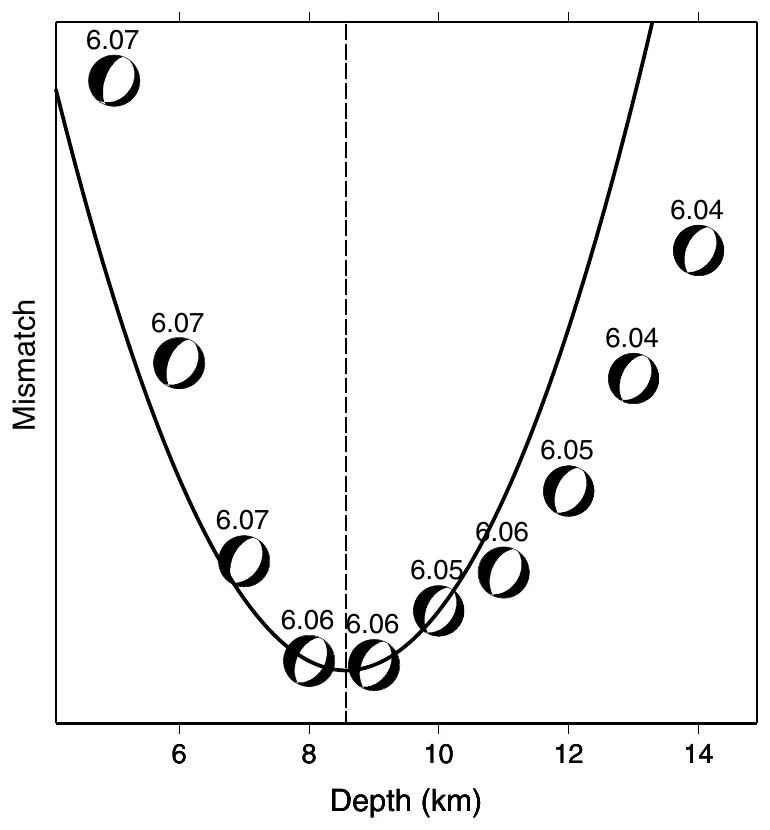
Figure from the study: CAPjoint source inversion software
Software · moderate earthquakes

CAPjoint source inversion software

CAPjoint fits local and teleseismic waveforms together to find the fault mechanism, depth, and magnitude of moderate earthquakes recorded by few stations. For the 2008 Wells, Nevada, earthquake it found Mw 6.06 at 8.6 km depth. Adding a single local station to four teleseismic stations brought the result close to the solution from many stations.

Chen, W., Ni, S., Kanamori, H., Wei, S., Jia, Z., & Zhu, L. (2015), Seismological Research Letters. Paper · PDF
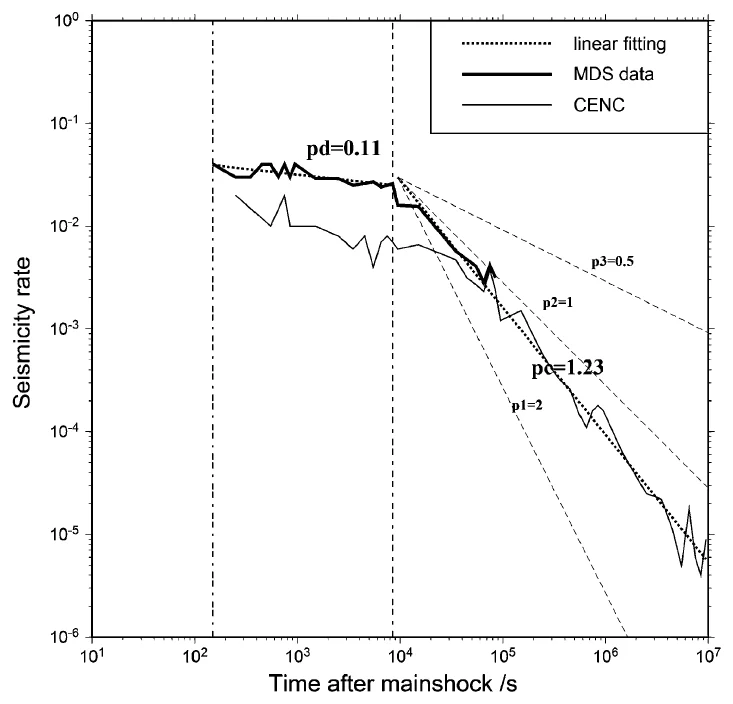
Figure from the study: Early aftershocks of the 2013 Lushan earthquake
Apr 2013 · Ms 7.0 · Sichuan

Early aftershocks of the 2013 Lushan earthquake

Catalogs miss many aftershocks in the first hours after a large earthquake. Detecting them in 24 hours of continuous data from one station 30 km away found 734 aftershocks, against 372 in the national catalog. The aftershock rate stayed nearly flat for about 8,000 seconds before the usual Omori decay began.

Jia, Z., Chen, W., & Chu, R. (2013), Earthquake Science. Paper · PDF