The problem
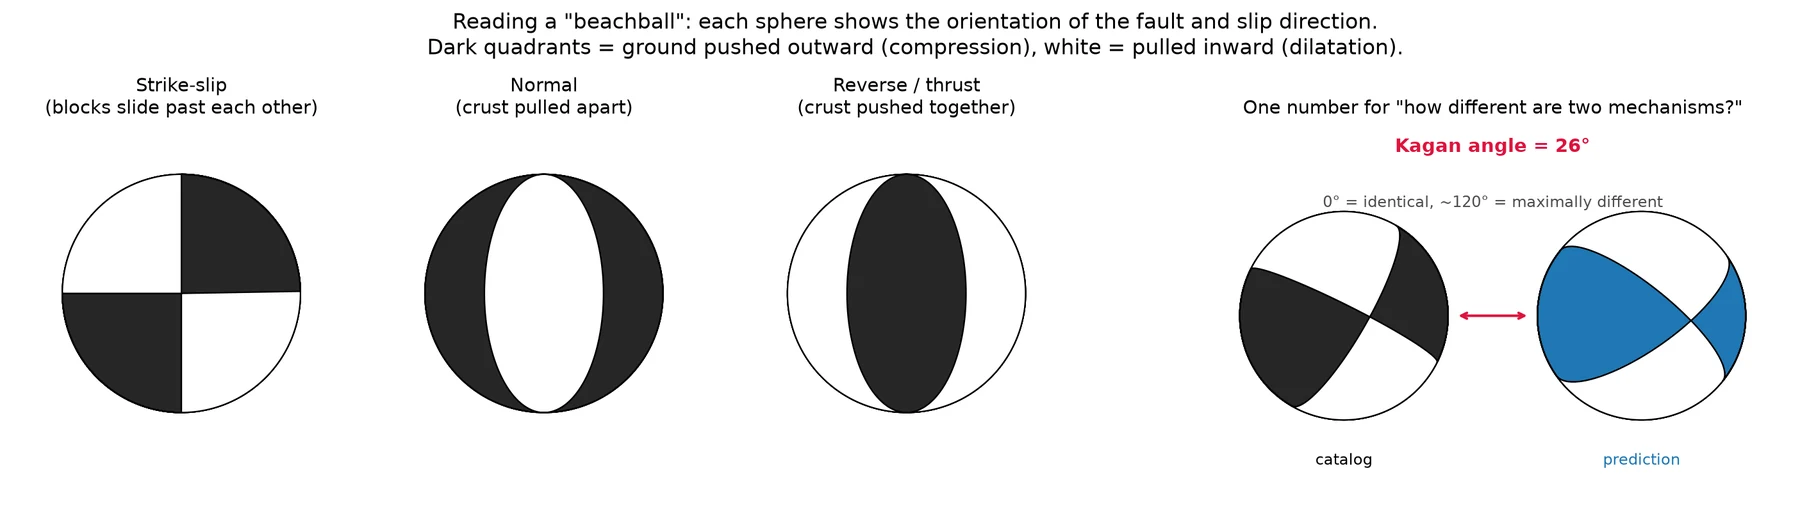
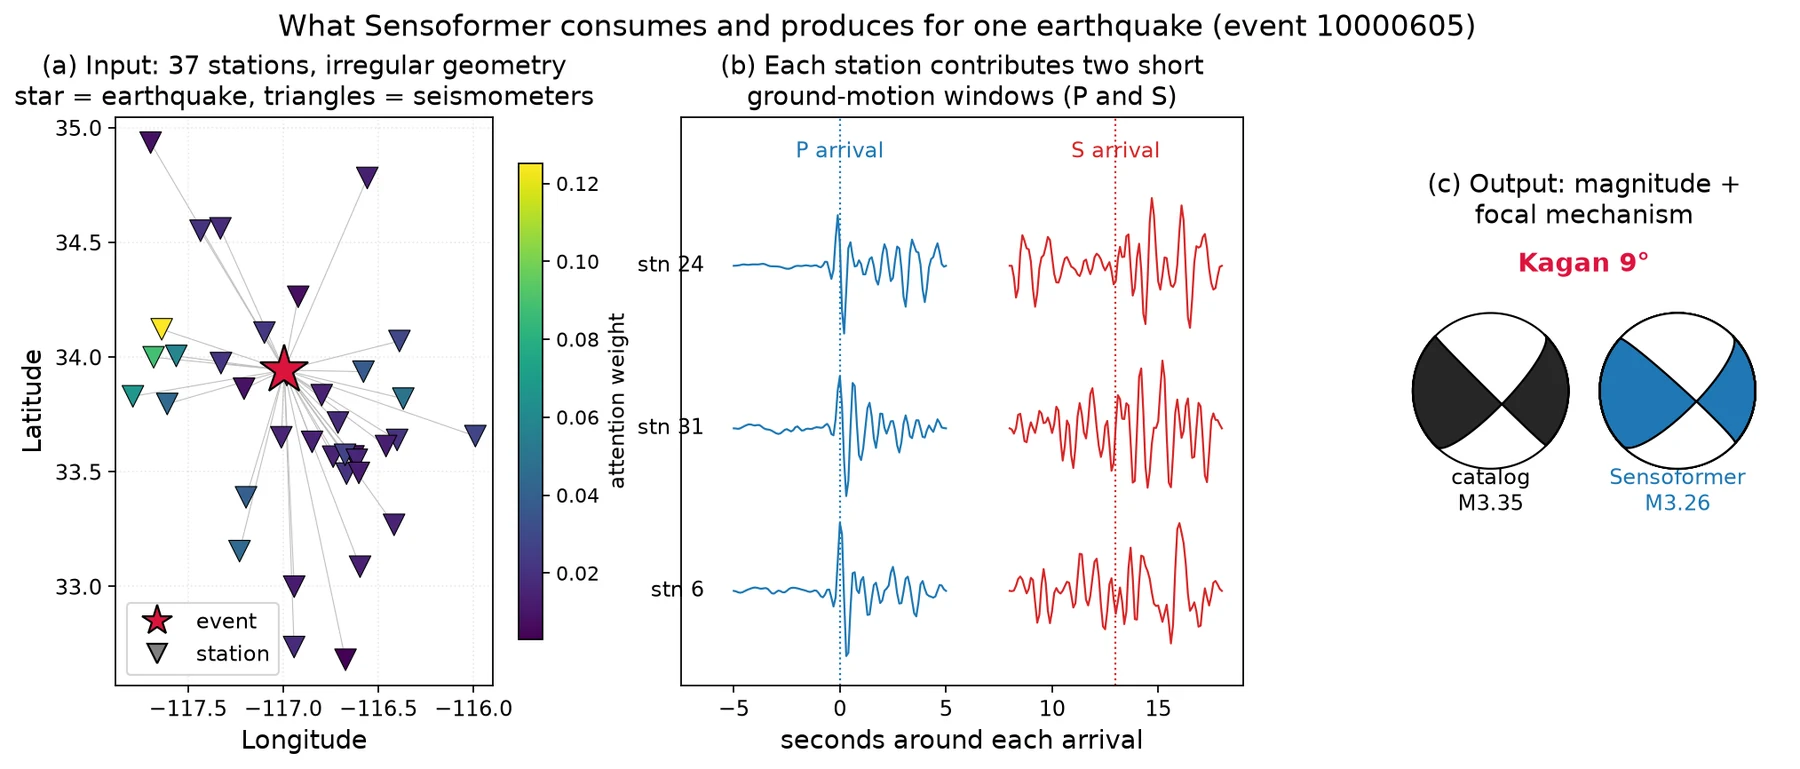
When a fault slips, seismometers across the region record the waves. The pattern of first pushes and pulls across stations, together with the relative sizes of P and S waves, encodes the focal mechanism: the orientation of the fault and the direction of slip. Seismologists draw it as a "beachball". Accuracy is measured with the Kagan angle, the smallest rotation that turns one mechanism into another. Identical mechanisms are 0° apart, and two random mechanisms are about 75° to 80° apart on average.
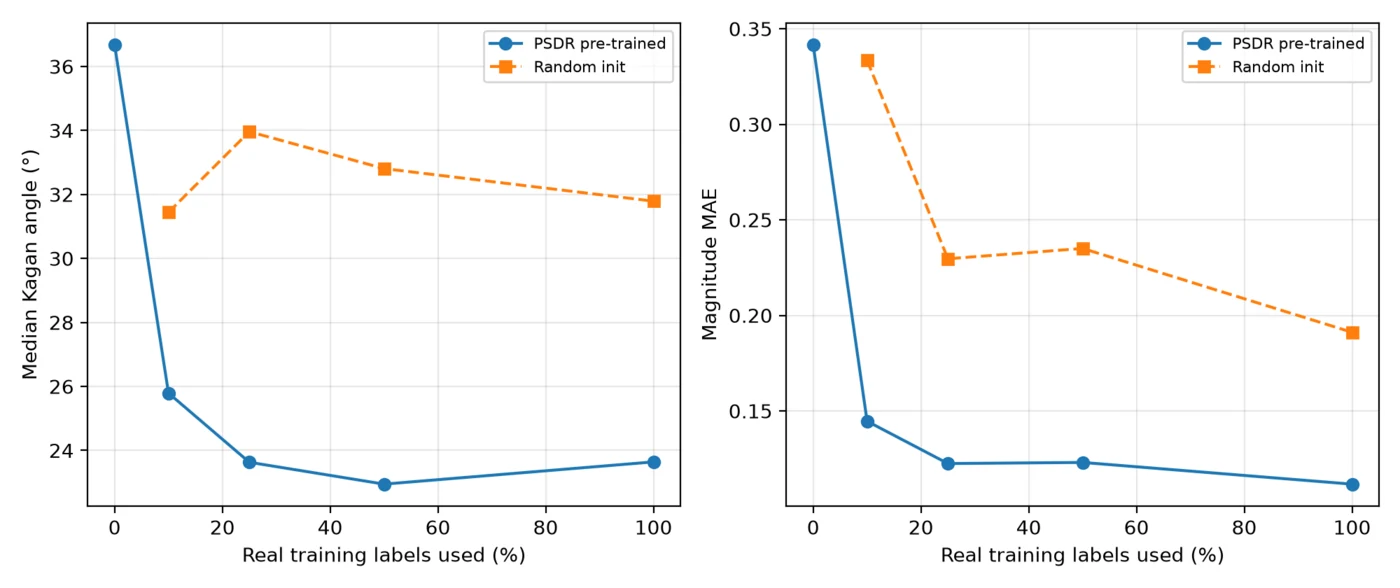
Every earthquake is recorded by a different, irregular set of stations, from about 10 to more than 80, sometimes all on one side. A single station cannot resolve the mechanism, so the model has to combine information across stations. Reliable labels are scarce: this study uses 2,435 well-constrained events. Physics simulations can supply as many training examples as needed. A model trained on clean simulations reached a median error of 4.37° on simulations and 33.57° on real data, even after fine-tuning on real events. This sim-to-real gap is the main problem Sensoformer addresses. The classical approach solves a separate inversion for every event.
The model
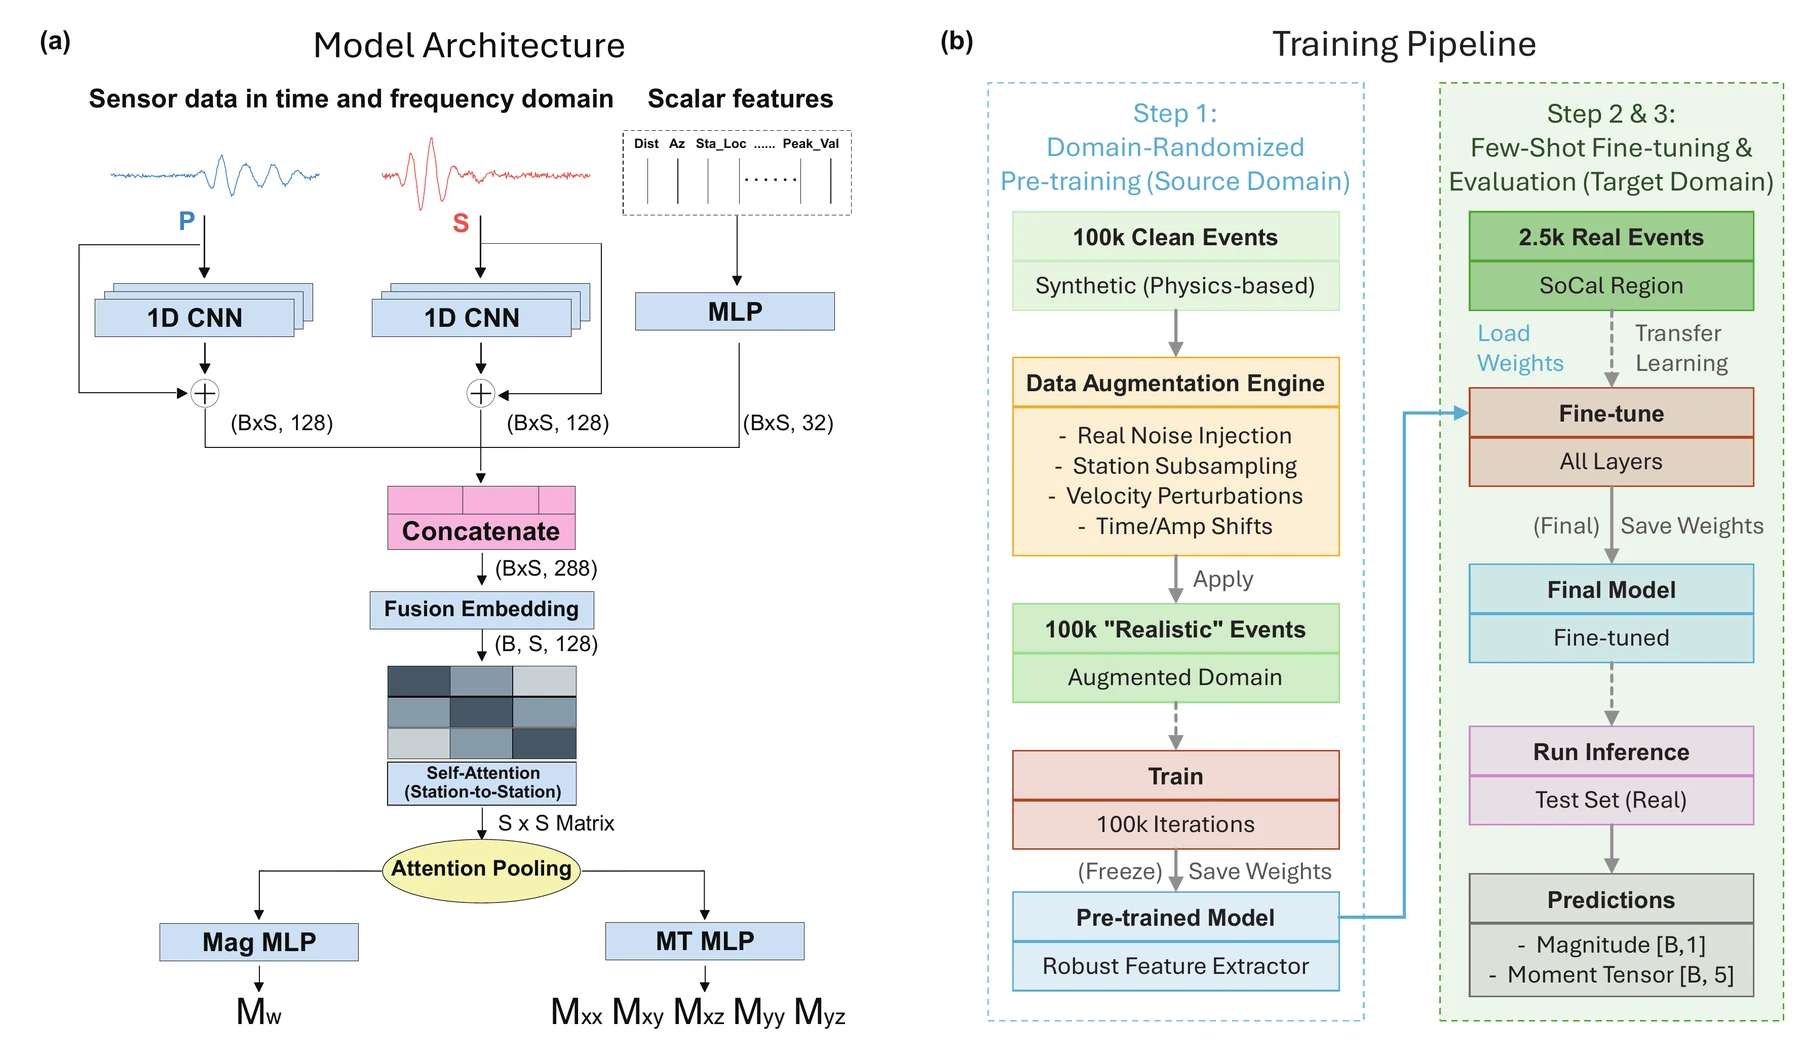
Each station becomes one token. Two 1D ResNet towers with separate weights read a 10-second P window and a 10-second S window (three components each, plus their amplitude spectra). A small MLP encodes 20 scalar features, including distance, azimuth, station coordinates, depth, and amplitude ratios. The three outputs are fused into a 128-dimensional station token. Station geometry enters only through these features, and there is no positional encoding, so the model treats the stations as a set.
A three-layer transformer encoder lets every station attend to every other station, with a padding mask for missing ones. Attention pooling combines the station tokens into one event embedding, and two heads predict the magnitude and the five independent components of the normalized moment tensor. The released model has about 2.1M parameters.
Physics-structured domain randomization
The synthetic data are generated with frequency-wavenumber simulations on real station geometries. Physics-structured domain randomization (PSDR) then perturbs the physical causes of the gap between simulation and reality. It is written as X = M(T(S(y, φ)) + n):
| Module | What it randomizes | What it stands for |
|---|---|---|
| φ, Earth model | 1D velocity profiles drawn from CRUST1.0 across the region | unknown subsurface structure |
| T, distortion | travel-time shifts of ±8%, P and S amplitude scaling, synthetic coda | 3D structure and scattering missing from the simulation |
| n, noise | more than 50,000 real pre-event noise records from Southern California stations | real instrument and site noise |
| M, masking | random subsets of 30 to 50 stations | outages and changing network coverage |
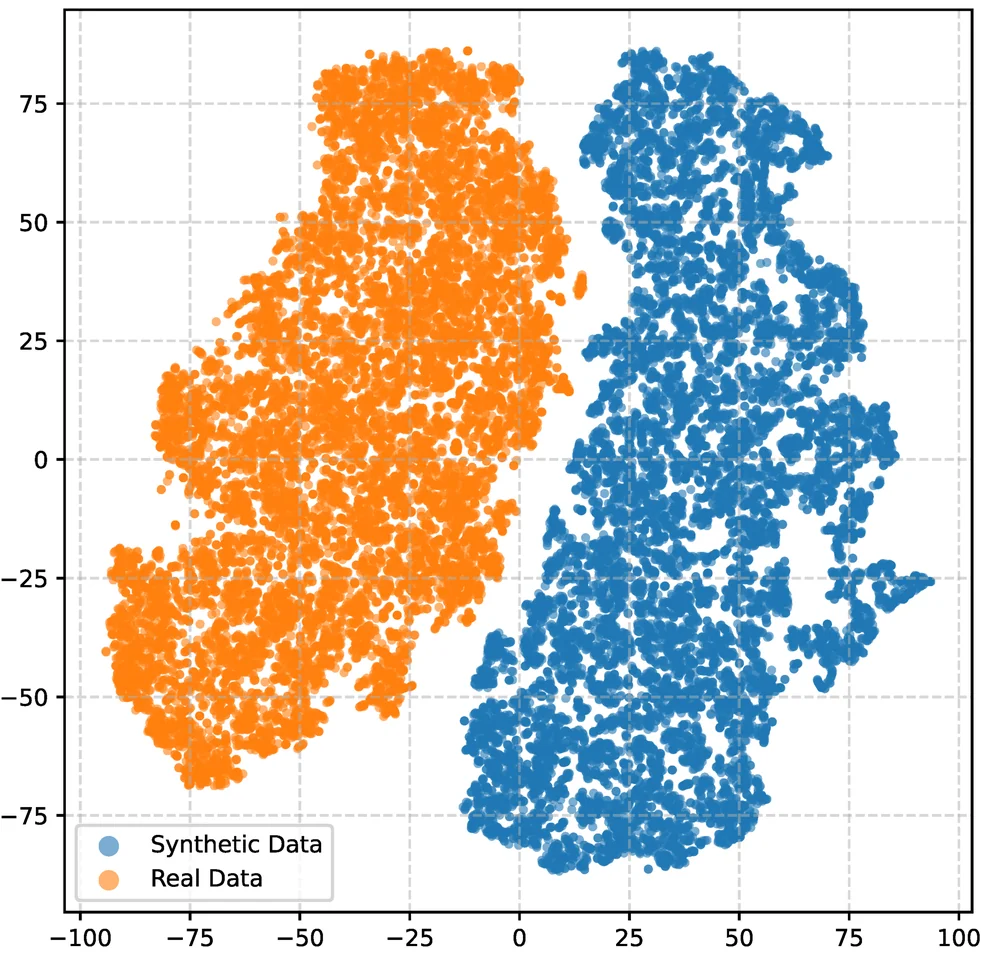
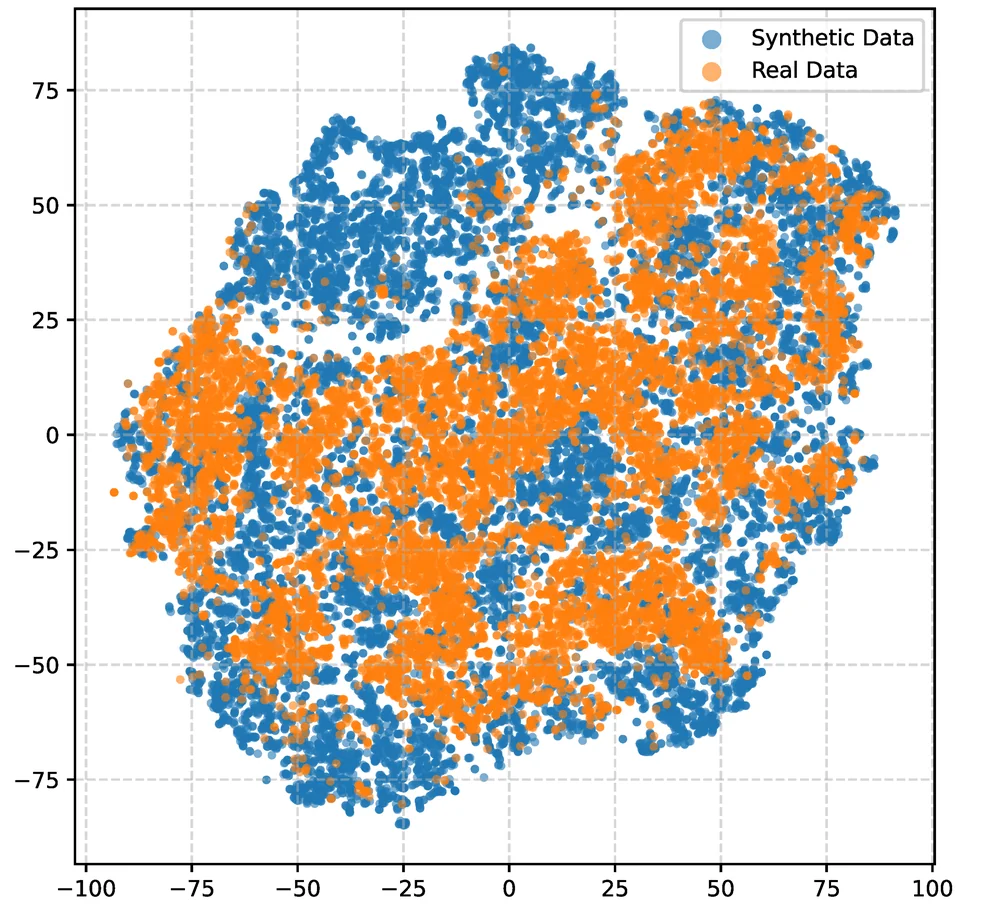
Measured on the embeddings, PSDR cuts the distance between simulated and real data (MMD²) from 0.7213 to 0.1566, a 78.3% reduction. The gap shrinks and does not disappear: both values are significant at p = 0.001. Removing any one module makes the fine-tuned model worse. Real noise and waveform distortion matter most.
Results
On 244 held-out real events, Sensoformer has a median Kagan angle of 19.76°, a mean of 23.90° (95% CI 21.83° to 26.06°), and a mean magnitude error of 0.0996. All baselines below share the same station encoder and training pipeline, and every one is significantly worse in a paired bootstrap.
| Model | Magnitude MAE | Mean Kagan | Median Kagan |
|---|---|---|---|
| Sensoformer | 0.0996 | 23.90° | 19.76° |
| Message passing (GAT, 5 nearest stations) | 0.1390 | 30.35° | 23.68° |
| Message passing (GCN, 5 nearest stations) | 0.1391 | 31.20° | 24.31° |
| No synthetic pretraining | 0.1849 | 32.86° | 25.20° |
| DeepONet | 0.1409 | 35.41° | 28.53° |
| DeepSets, no station interaction | 0.1403 | 35.67° | 29.11° |
| MLP on pooled inputs | 0.1380 | 41.94° | 38.20° |
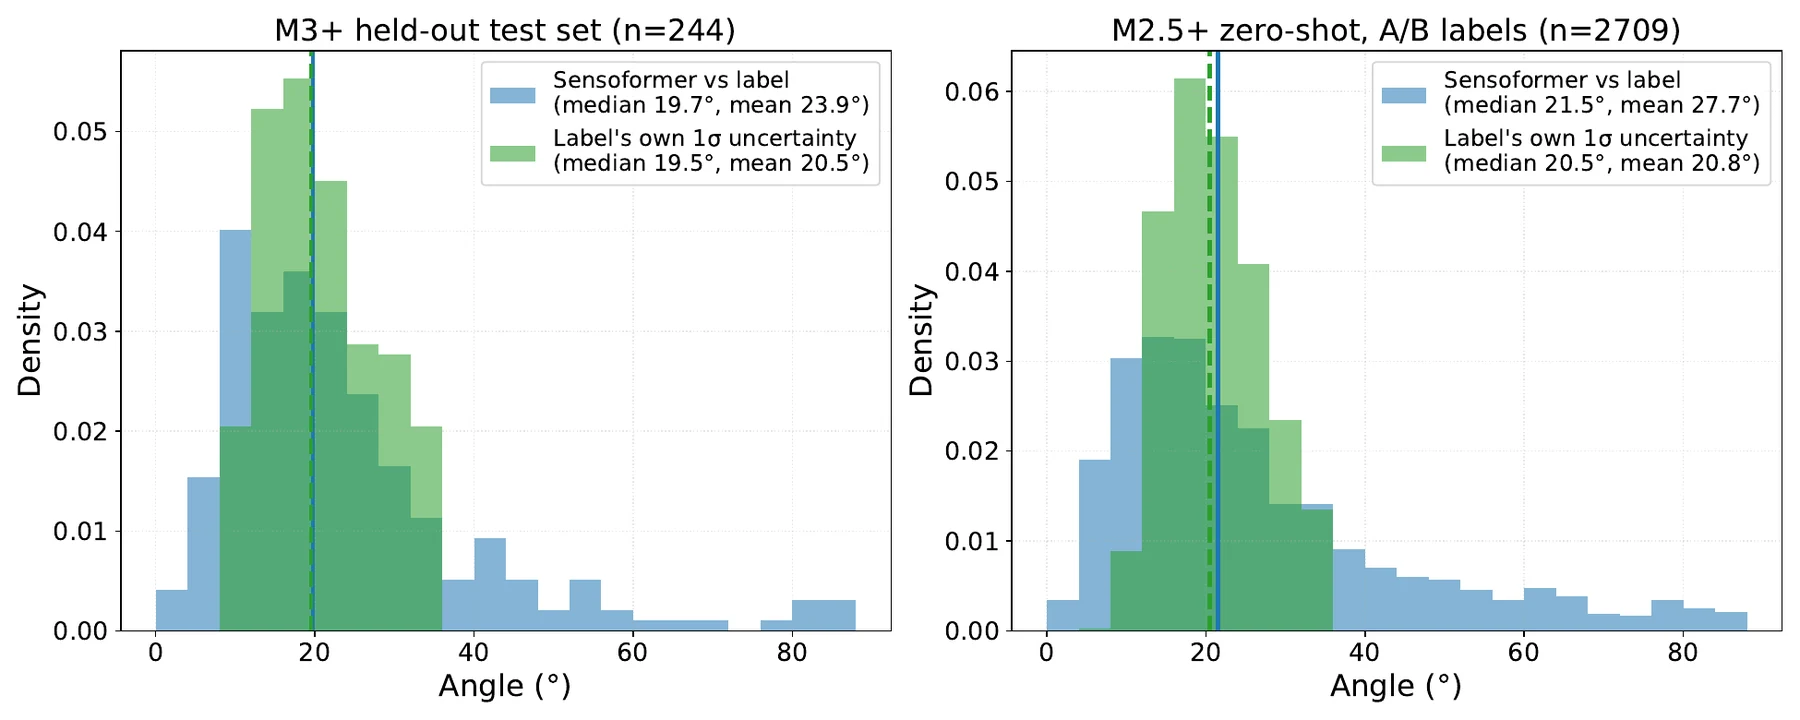
The remaining error is set mostly by network geometry. The median error falls from 26.7° with 10 to 15 stations to 16.8° with 50, and rises from 16.8° when the largest azimuthal gap is under 45° to 32.7° when it exceeds 180°. On typical events, the model's disagreement with the catalog (median 19.7°) matches the catalog's own uncertainty (median 19.5°).
Catalog-scale use
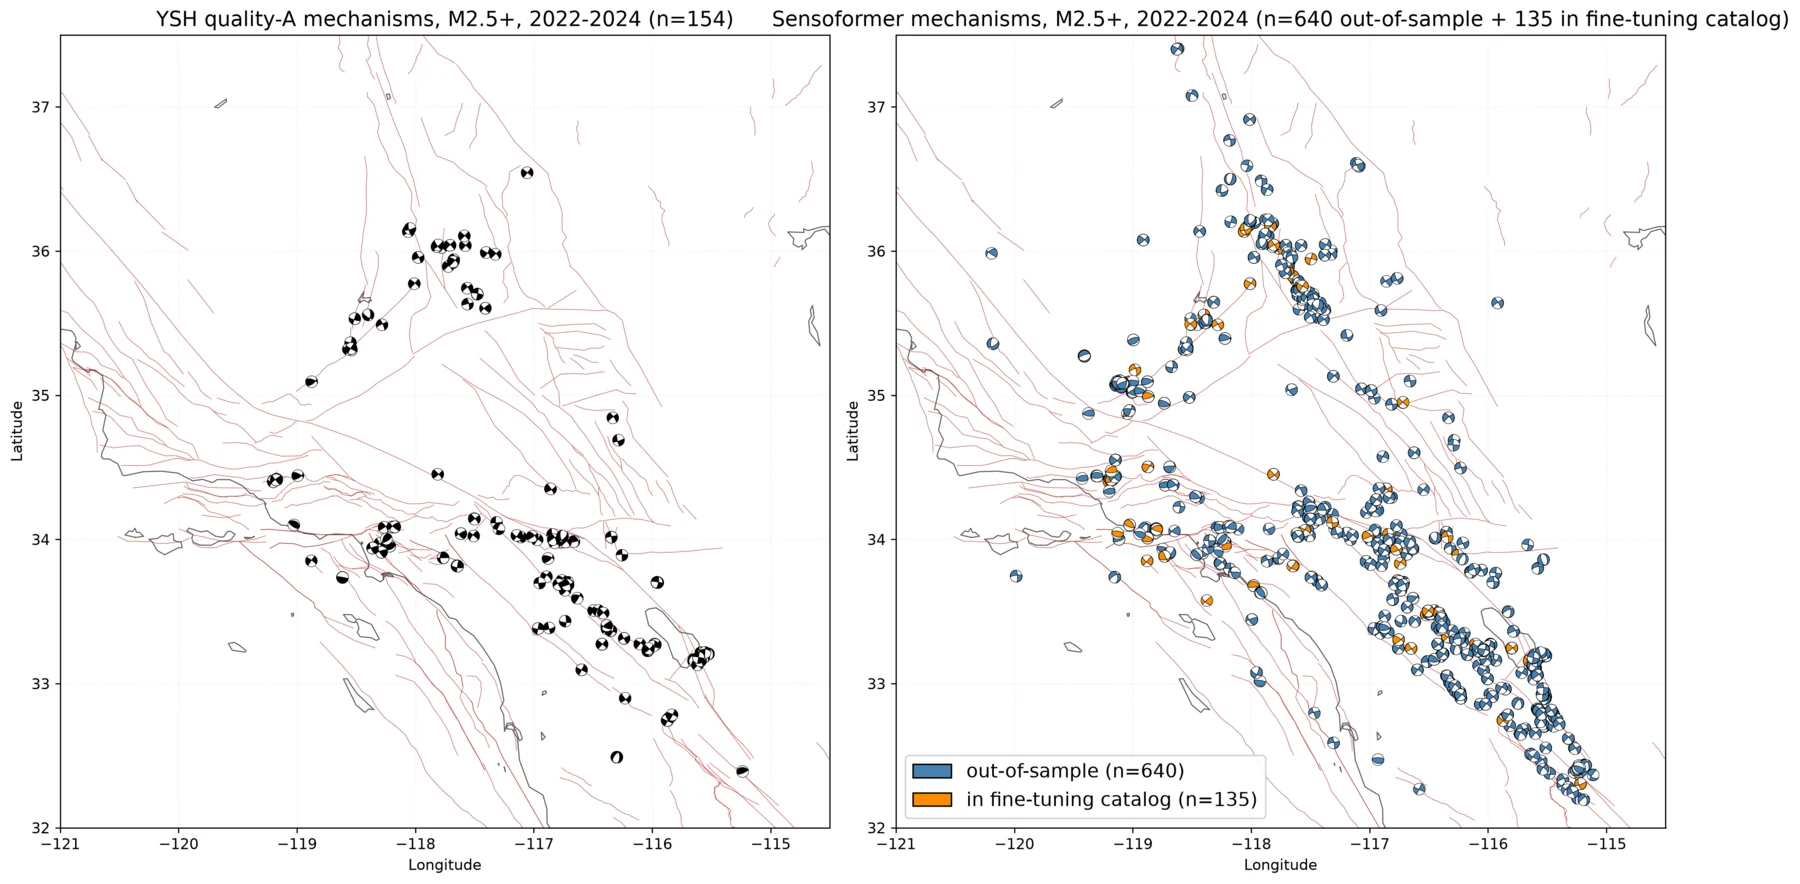
I ran the model on every Southern California earthquake of magnitude 2.5 and above with at least 10 usable stations from 1992 to 2024, which gives 7,134 mechanisms. Against reliable catalog solutions (2,709 events), the median Kagan angle is 21.51°. For 2,699 events, the catalog has only low-quality solutions. The model adds usable mechanisms for them, a 31.8% increase over the 8,497 reliable solutions in the same period.
Uncertainty
Conformal prediction gives calibrated intervals on top of the point model: at 90% coverage, ±0.217 in magnitude and a 44.8° ball around the mechanism. A conditional normalizing flow trained on simulations is calibrated in simulation and covers only 37% of real events at nominal 90%. After fine-tuning and conformal recalibration, its coverage is 0.901, and the size of its uncertainty region follows the actual error and the azimuthal gap.
What I learned
- Fine-tuning cannot repair what pretraining did not learn.With the same seed, clean pretraining followed by real fine-tuning gave 33.57° median error and PSDR pretraining gave 19.52°.
- Randomize the physics that differs between simulation and reality.Each of the four modules targets one cause of the gap, and removing any of them hurts the real-data error.
- Global interaction helps more than local graphs.All-to-all attention beat 5-nearest-neighbor message passing, and adding attention to the local graph (GAT versus GCN) made no significant difference.
- Pooled features lose the mechanism.An MLP on pooled inputs predicts magnitude well and the mechanism poorly, because the mechanism lives in how polarity varies with azimuth across stations.
- Test small gains with paired statistics.Several architecture changes that looked better on point estimates disappeared under a paired bootstrap, including a geometry attention bias and an orientation loss.
Code, data, and citation
The code includes training, inference, preprocessing, and every baseline. The pretrained and fine-tuned weights and the real and synthetic datasets are on Hugging Face. Labels come from the Southern California focal mechanism catalog of Yang, Hauksson, and Shearer (2012), with waveforms from the Southern California Earthquake Data Center.
@article{jia2026sensoformer,
  title   = {Sensoformer: Robust Sim-to-Real Inference on Variable-Geometry
             Sensor Sets via Physics-Structured Randomization},
  author  = {Jia, Zhe and Zhang, Xiaotian and Li, Junpeng},
  journal = {arXiv preprint arXiv:2601.06320},
  year    = {2026}
}